
Waves has enjoyed a week of ascending prices as the market rises by 3.83% over the past 7 trading days. Waves is currently trading at a price of $2.86 at the time of writing, and has seen a small price drop of 0.49% over the past 24 hours.
The Waves platform was initially released on June 7, 2016 and was created initially to allow users to create custom crypto tokens in a simple and easy way. The user can then distribute these tokens however they wish, thereby creating their own decentralized economic system.
The Waves platform also includes a decentralized exchange (DEX). This DEX allows users to exchange cryptocurrency tokens between each other without the need for a centralized crypto exchange such as Bittrex, BitFinex or Coinbase. The DEX platform also has fiat gateways in both USD and EUR, allowing users to seamlessly transfer fiat into cryptocurrency.
Waves is a fascinating project with many divisions, we highly recommend to read our “What is Waves” guide.
Waves currently has a market cap value of $285 million which puts it in rank 46th in terms of overall market cap cross the entire industry. This is a significant $507 million than the market cap high of $792 million seen on April 2, 2017. Waves has significant losses to regain as the value of the cryptocurrency has dropped by 17.38% over the last 30 trading days.
Let us continue to analyze price action over the long term for Waves.
Price Analysis
WAVES/USD – LONG TERM – DAILY CHART
https://www.tradingview.com/x/84NkYteO/
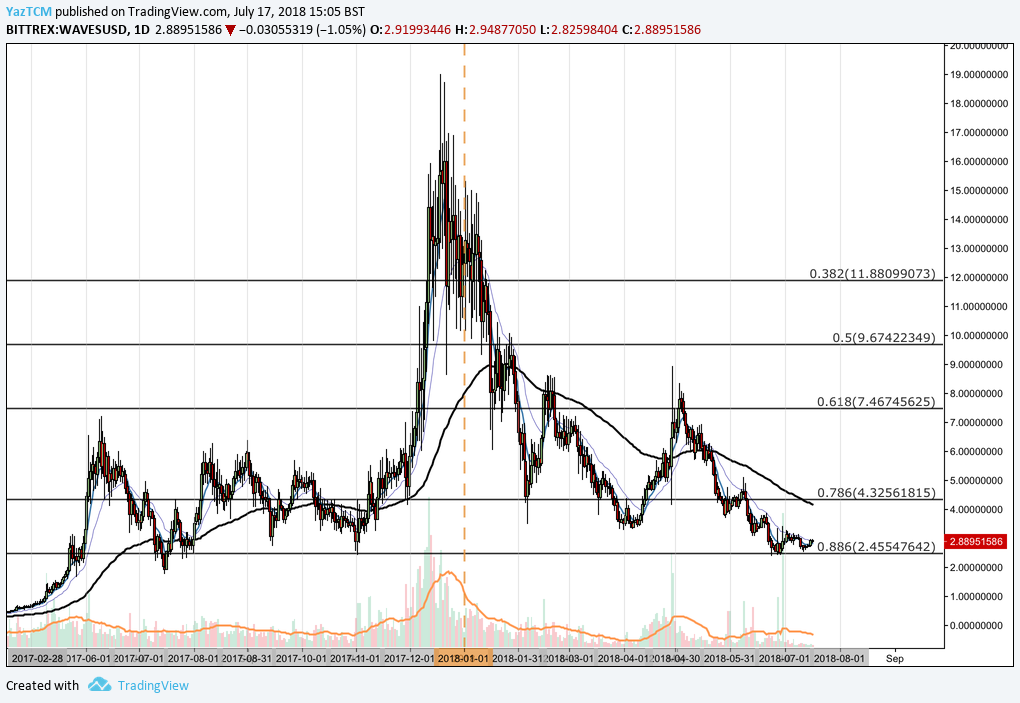
Analyzing the market over the long-term perspective, we can see that the market had experienced 2 bullish runs throughout the year of 2017, one from April-June 2017 and the other from November-December 2017. The entire bullish run combined started from a low of $0.33 on April 2, 2017 and extended all the way to an all-time high of $18.98 placed on December 19, 2017. This was an incredible price increase of over 5,000% from low to high throughout the entire bull period of 9 months.
After placing the all-time high, we can see the market fell drastically during January and February 2018, originally finding support at the .786 Fibonacci Retracement priced at $4.32. This is a Fibonacci Retracement taken from the entire bullish run outlined above. The market held above the .786 Fibonacci Retracement for the majority of the year until it broke below in June 2018, when the market dropped and found support at the .886 Fibonacci Retracement priced at $2.45.
Price action is currently trading above the .886 Fibonacci Retracement, around the $2.88 level. It is important to note that the .886 Fibonacci Retracement level is the starting price of the bullish run experienced during November-December 2017, so significant support is expected in this area.
Let us continue to analyze price action over a closer time period to highlight potential support and resistance zones.
WAVES/USD – SHORT TERM – DAILY CHART
https://www.tradingview.com/x/mMvBMX18/
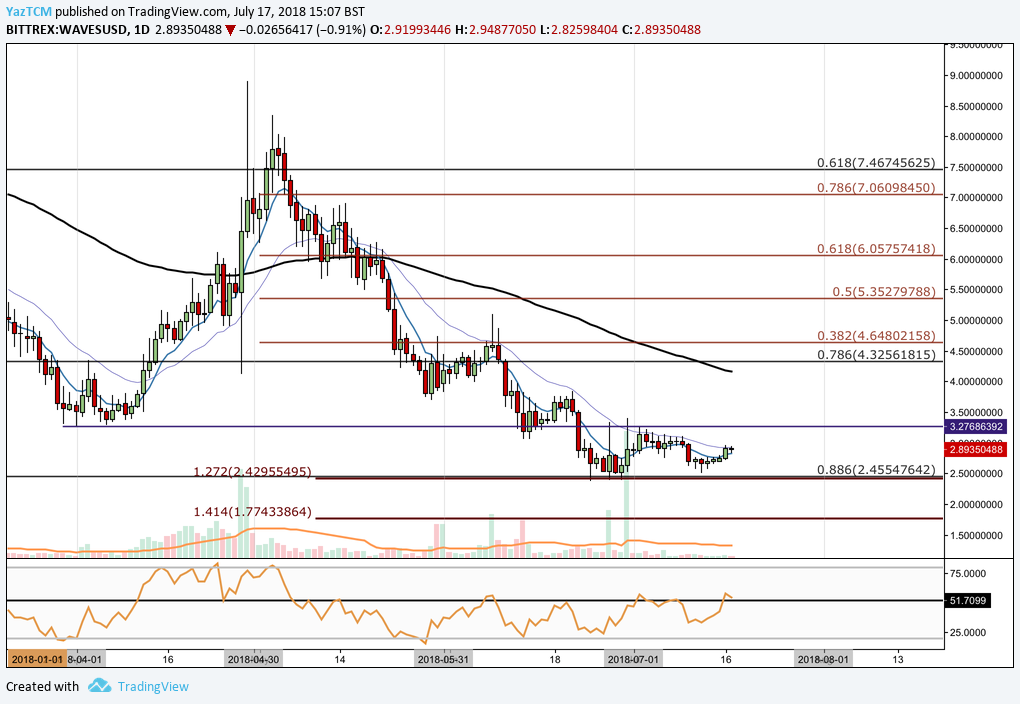
Analyzing the market from a closer perspective, we can see that Waves had experienced a smaller bullish run during April as price action rose from a low of $3.27 on April 1, 2018 and rose to a high of $8.33 on May 3, 2018. This was a price increase of 157% from low to high.
Price action went on to fall after placing this high and eventually fell below the price low seen on April 1, during mid-June 2018. We can see that price action fell until it gained support at the long-term .886 Fibonacci Retracement priced at $2.45. We can also notice that this area of support is bolstered by a downside 1.272 Fibonacci Extension priced at $2.49. This is a Fibonacci Extension taken from the entire bearish leg witnessed strictly during the month of May 2018.
For the current month of July, price action has been trapped within a range between the low seen on April 1, 2018 at $3.27 (purple horizontal line) and the long-term .886 Fibonacci Retracement priced at $2.45.
If the bullish momentum can push the market up above the upper boundary of the range at $3.27, then we can expect near-term resistance to firstly come at the 100-day moving average (falling black line) which is currently hovering around the $4 handle. Further resistance is expected at the .786 Fibonacci Retracement priced at $4.32.
Alternatively, if the bears step back into the market and push price action below the lower boundary of the range, we can expect near-term support to come in at the 1.414 Fibonacci Extension level priced at $1.77.
The technical indicators within this market are predominantly neutral at this moment in time. The RSI has popped above the 50 handle but is currently involved in a battle to stay above the 50 handle. If the RSI can remain above 50, we can expect the bullish momentum to continue.
Similarly, the moving averages are typically neutral, although they are shaping up for a bullish crossover. If the 7-day EMA (blue line) can cross above the 21-day EMA (purple line) this will constitute to a bullish crossover and we can expect the bullish pressure to increase.
Let us continue to analyze Waves price relative to Bitcoin over the long term.
WAVES/BTC – LONG TERM – DAILY CHART
https://www.tradingview.com/x/NMNPVpkB/
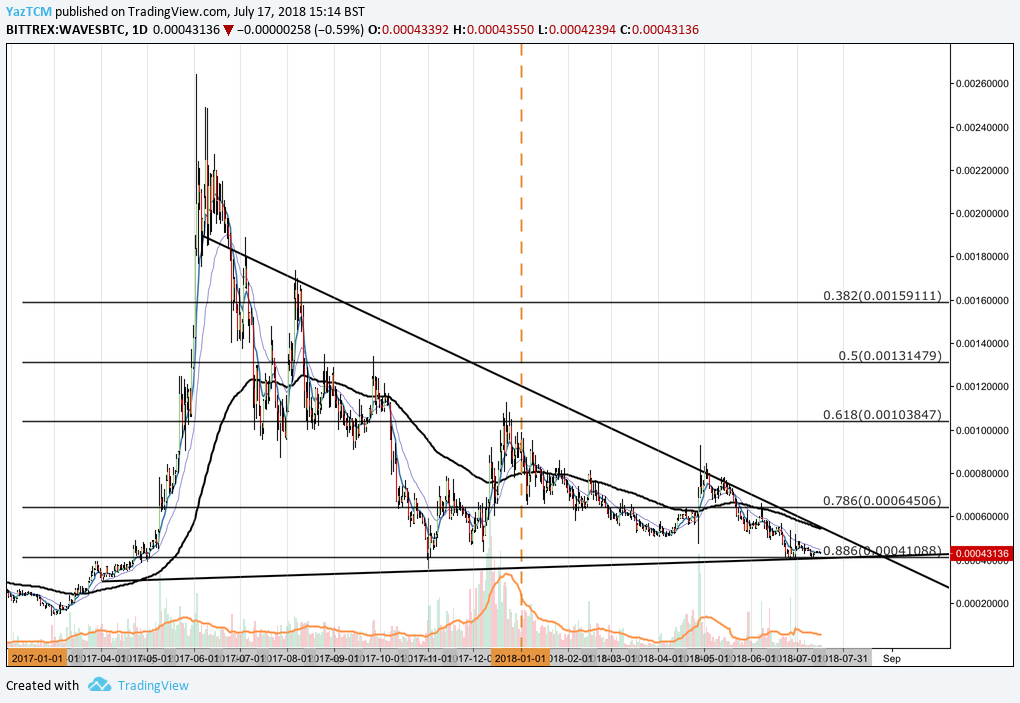
Analyzing Waves relative to Bitcoin, we can see that the Waves had an extraordinary price increase against Bitcoin in early 2017, when price action rose from a low of 14,504 SATS experienced on March 3, 2017 and extended to an all-time high of 264,200 SATS on June 3, 2017. This was an epic price increase of over 1,700%.
We can see that the market depreciated from this all-time high and has since never recovered. Price action descended all the way to a low of the .886 Fibonacci Retracement level priced at 41,088 SATS in November 2017. This is a Fibonacci Retracement taken from the entire bullish run outlined above. We can see that price action is currently trading once again at this .886 Fibonacci Level today, where significant support has been experienced.
It is also important to highlight that the market has been consolidating within the confines of a large, loose symmetrical triangle expanding over a period of 15 months. This is a very long-term triangle and price action is quickly approaching the apex of the triangle where, typically, a breakout is expected either to the upside or the downside.
Let us continue to analyze the market over the period of the last 10 months to highlight any potential support and resistance areas.
WAVES/BTC – LONG TERM – DAILY CHART
https://www.tradingview.com/x/zplPHKIH/
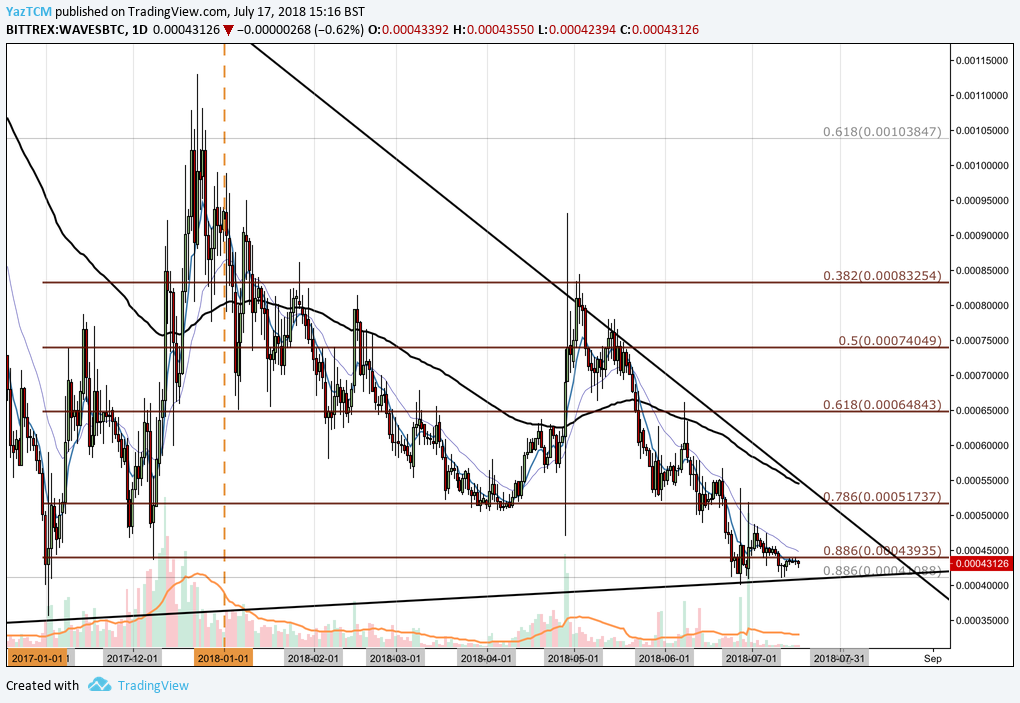
Analyzing the market at a little closer perspective, we can see that price action had experienced a smaller bullish run during November-December 2017 when the market rose from a low of 40,000 SATS on November 1, 2017 and rallied to a high of 112,990 SATS on December 23, 2017. This was a price increase of 210% from low to high.
We can see that the market has depreciated, originally finding support at the short term .786 Fibonacci Retracement priced at 51,737 SATS. This short term FIbonacci Retracement is taken from the bullish run seen during November-December 2017.
Price action continued to fall and eventually fell below the .786 Fibonacci Retracement during June 2018, where it fell until it found support at the long term .886 Fibonacci Retracement priced at 41,088 SATS. This area of support was also bolstered by the lower boundary of the symmetrical triangle.
We can see that price action has currently met resistance at where it is trading by the short-term .886 Fibonacci Retracement priced at 43,395 SATS. If the bullish momentum can push price action above 43,395 SATS, then we expect near term resistance to be located at the .786 Fibonacci Retracement level priced at 51,373 SATS. A push beyond this level will cause the market to break toward the upside of the symmetrical triangle and would require significant volume to be achieved.
Alternatively, any bearish pressure should be supported by the long-term .886 Fibonacci Retracement priced at 41,088 SATS and the lower boundary of the symmetrical triangle.
Related: What 2018 Holds for Waves: A Look At Its Progress So Far and What’s Next