
One of top 20 cryptocurrencies, VeChain, has experienced a week of bullish price action as the market has risen by 9.46% over the past 7 trading days. The crypto giant is currently trading hands at $2.78, at the time of writing, enjoying a 2.53% price hike over the past 24 hours alone.
VeChain was created to become a trust free and distributed ecosystem specializing in supply chain management. Using the VeChain Identity Technology (VID), manufacturers and producers can assign supplies or products with unique identifiers. This identifier can then be integrated with the product through QR codes, NFC chips or RFID tags and can be used by suppliers, retailers and consumers to verify the authenticity, quality and quantity available of that specific product. This creates a new standard of asset digitization on the blockchain for supply chains that can be relied upon as it is tamper proof.
VeChain was founded in 2015 and has already enjoyed favorable partnerships with reputable companies such as BitOcean, PWC, Renault and Microsoft. The cryptocurrency is currently undergoing a token migration as the VEN network tokens switches from the Ethereum blockchain to new VeChain Thor blockchain launched on June 30. This new blockchain has claimed that it can handle up to 10,000 transactions per second (TPS), significantly higher than the 25 TPS that Ethereum is currently able to process.
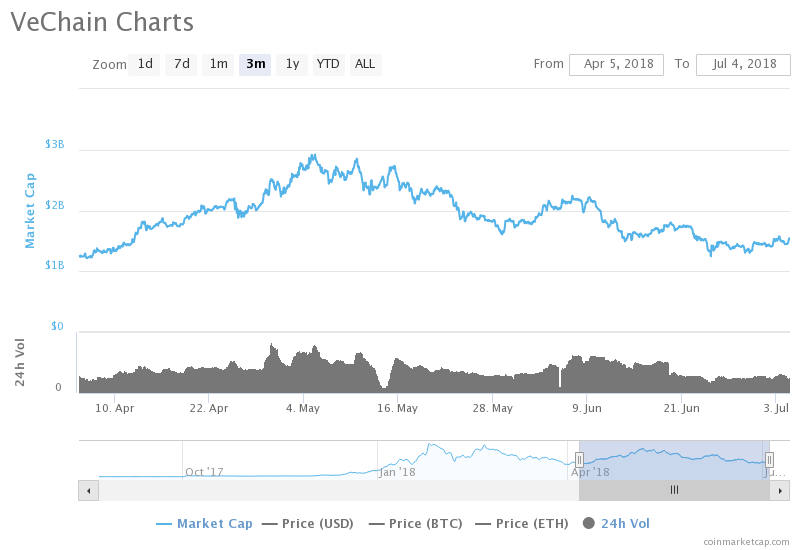
VeChain is currently ranked 18th in terms of overall market cap across the entire industry, with a market cap value of $1.54 billion. This is down by a total of $600 million from the market cap high seen last month on June 4 at a value of $2.14 billion. The market has some significant losses to regain from the last month as price value has dropped by 28.15% over the past 30 trading days, and much further over the longer term as shown in the market cap graph below.
Let us analyze price action over the long term for VenChain.
Price Analysis
VEN/USD – LONG TERM – DAILY CHART
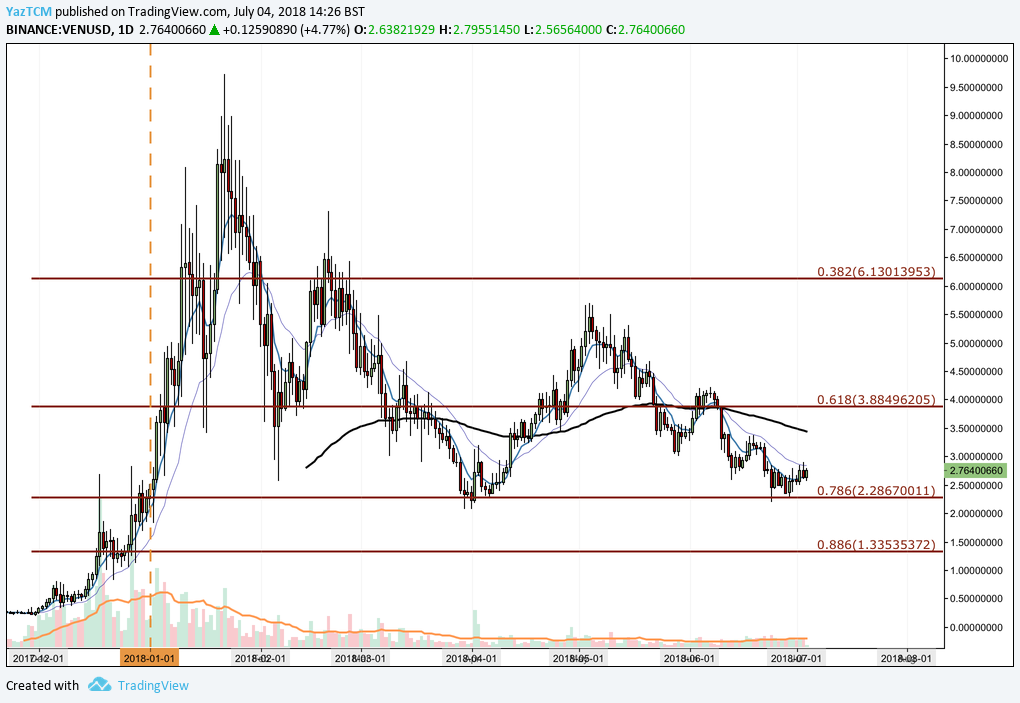
https://www.tradingview.com/x/2c2E4iBc/
Analyzing price action from the long-term perspective above, we can see that, like most altcoins around this period, VEN had experienced an incredible bullish run rising from a low of $0.22 on December 1, 2017 to an all time high of $9.71 on January 22, 2018. This was an epic price increase of over 5,000% from low to high.
Since placing the all-time high, price action went on to depreciate, initially finding support at the .618 Fibonacci Retracement, priced at $3.88, in February 2018. This is a Fibonacci Retracement taken from the entire bullish run outlined above. Price action continued to decline through March until reaching support at the .786 Fibonacci Retracement, priced at $2.28 in April.
Price action has currently returned to support level at the .786 Fibonacci Retracement after experiencing 2 continued months of declining prices during May and June. If the market can pick up some bullish momentum, the nearest area of resistance from a long-term perspective comes at the .618 Fibonacci Retracement, priced at $3.88. If the market can clear this level, it will be free to tackle May’s price high again at $5.69.
Alternatively, if the previously seen bearish momentum continues and pushes prices below the .786 Fibonacci Retracement, then the nearest level of support from a long-term perspective is located at the .886 Fibonacci Retracement priced at $1.33.
Let us continue to analyze price action over the more recent term a little closer.
VEN/USD – SHORT TERM – DAILY CHART
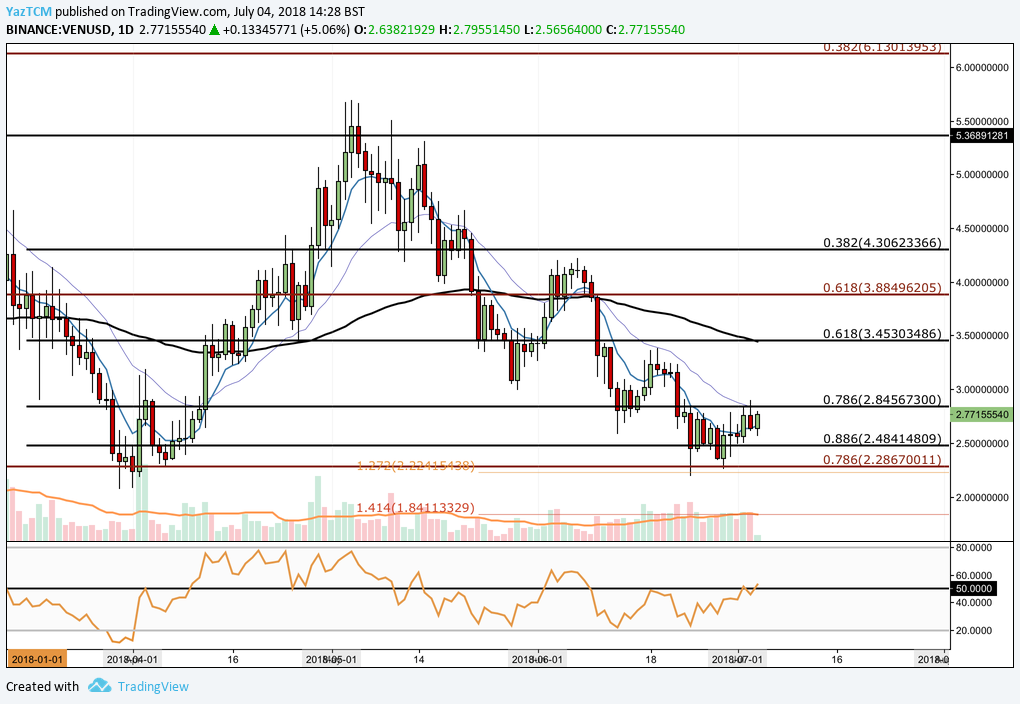
https://www.tradingview.com/x/opllhwby/
Analyzing the market at a shorter time period, we can see that VEN had experienced another bullish run during April, rising from a low of $2.07 on April 1, 2018 to a high of $5.69 experienced on May 4, 2018. This was a respectable price increase of 170% in price from low to high.
Price action went on to fall during the rest of May, originally finding brief support at the short term .618 Fibonacci Retracement (marked in black), priced at $3.45. This is a Fibonacci Retracement taken from the bullish run seen during April. Price action went on to fall further during June, firstly finding support at the short term .786 Fibonacci Retracement, priced at $2.84, before breaking below and finding further support at the short term .886 Fibonacci Retracement, priced at $2.48. We can also see that price action briefly spiked further lower before being strongly rejected by the long term .886 Fibonacci Retracement (marked in red), priced at $2.28.
Price action has since rebounded and is currently testing resistance at the .786 Fibonacci Retracement once again priced at $2.84. If the bullish momentum can continue within the market and push prices above $2.84, then near-term resistance is located at the .618 Fibonacci Retracement, priced at $3.45. Significant resistance is expected in this area due to added pressure from the 100-day moving average being located here. If the market can continue further above this level, then it will be free to retest June’s price high at $4.22.
Alternatively, if the bullish momentum recently experienced is short lived, initial support can be found at $2.48 followed by the long term .786 Fibonacci Retracement at $2.28. Support below this level can firstly be located at the April low of $2.07 followed by the 1.414 Fibonacci Extension priced at $1.84.
The technical indicators are starting to show some favor toward the bulls. The RSI has recently battled its way to the upside above the 50 handle, highlighting the recent bullish momentum within the market. If the RSI can maintain above the 50 handle, then we expect the bullish momentum to continue.
Similarly, the 7-day EMA moving average (blue line) has began to show signs of reversing as it starts to approach the 21-day EMA (purple line). If the 7-day EMA can cross up above the 21-day EMA, this would act as a bullish crossover indicating that the market is in the midst of a bullish reversal.
Conclusion
With VeChain launching its own blockchain recently, the future is likely to be very promising for token holders. However, during a token migration, trading volume is likely to decline as investors and traders tend to trade less during uncertain fundamental times.
The token migration is expected to occur during mid-July. Once it is complete, we are expecting the market to react promisingly as VeChain continues to release regular development updates.