Ripple, the cryptocurrency that claims to be the fastest and most scalable digital asset, has plunged further this week as prices drop a further 14.97% over the past 7 trading day, reaching 7-month fresh lows.
XRP, at the time of writing, is trading hands at a price of $0.42 and is down by 6.25% over the past 24 hours alone. It was founded in 2012 by a company called Ripple Labs, and has already managed to partner with over 100 banks and financial institutions across the globe in its short lifespan.
The Ripple team specializes in numerous tools and applications for banks and financial institutions to make it easier to process payments for their clients, allowing for faster banking. The Ripple team has stated that it is the most scalable cryptocurrency, claiming that the Ripple network can already process up to 1,500 transactions per second (TPS). This is far superior to the meagre 25 TPS that Ethereum can currently handle today. For more information of Ripple, check out our “What is Ripple” guide.
Ripple currently ranks top 5 in terms of overall market cap across the entire cryptocurrency industry, with a market cap value of $16.83 billion, placing it in 3rd place. This is down by $2.83 billion from the market cap of $19.66 billion seen on June 22. This is even further down from the market cap of $20.54 billion seen during the bull run in April. The value of XRP has depreciated by a total of 30.79% over the past 30 days.
Let us analyze price action over the long term and see how the XRP market has been holding up.
Price Analysis
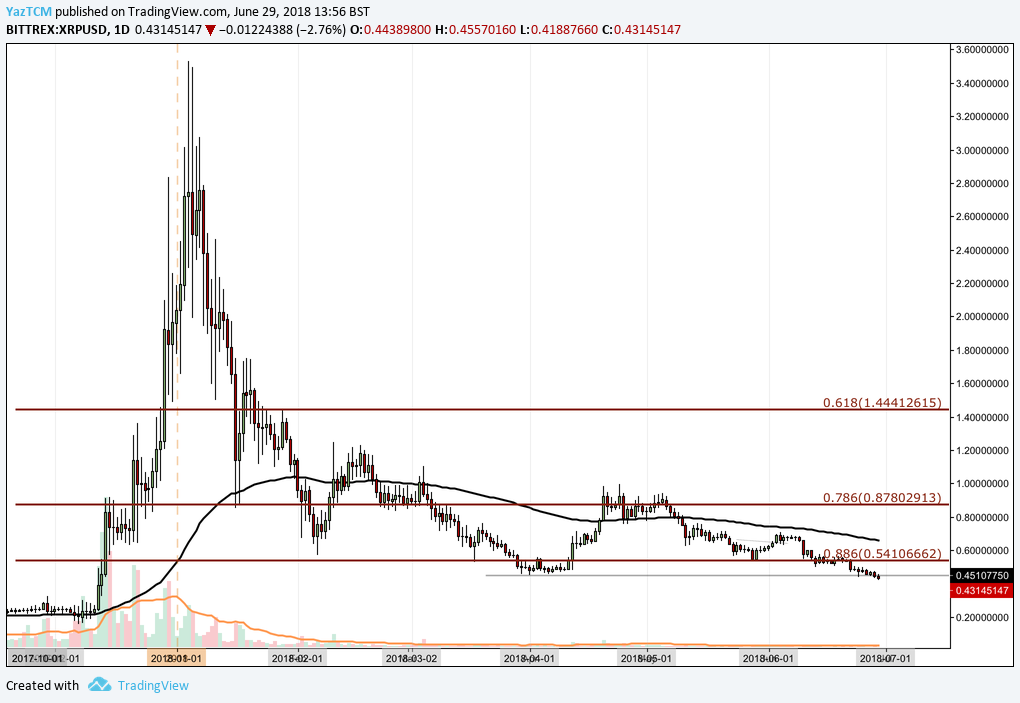
XRP/USD – LONG TERM – DAILY CHART
 https://www.tradingview.com/x/fiM1ijHT
Analyzing the market from the long term perspective above, we can see that XRP had experienced an incredible bullish run during December 2017 when price action rose from a low of $0.15 on December 7, 2017 to an all-time high of $3.53 on January 4, 2018. This was an extraordinary price increase of 2300% from low to high.
Understandably, after placing this all-time high, price action went on to depreciate through January 2018 until finding support at March/April 2018 lows at $0.45, represented by the horizontal grey line. This was marginally below the .886 Fibonacci Retracement (drawn in red), taken from the entire bull run seen in December 2017/January 2017, priced at $0.54. The market went on to rebound slightly before finding resistance at the .786 Fibonacci Retracement at $0.87 toward the end of April.
As June commenced, price action continued along its bearish momentum falling past the .886 Fibonacci Retracement and eventually breaking below Aprils low of $0.45 creating fresh lows not seen since mid-December 2017.
Let us continue to analyze price action from the more recent period a little closer.
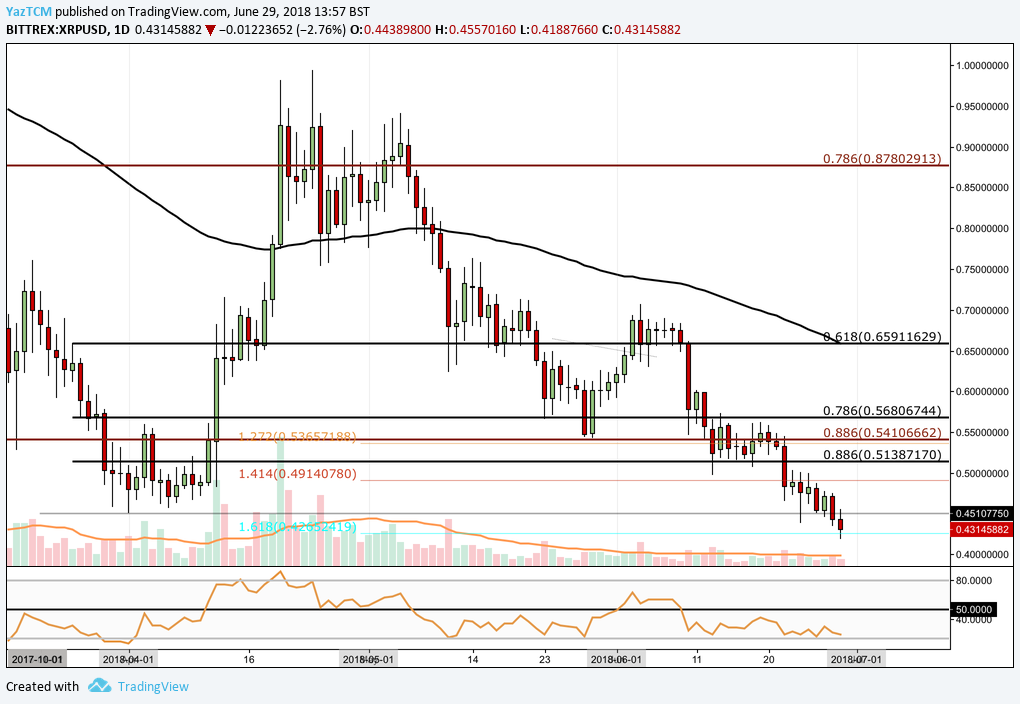
XRP/USD – SHORT TERM – DAILY CHART
https://www.tradingview.com/x/5uo7TSBM
Analyzing price action with the benefit of more detail, we can see that price action had experienced a significant bullish run during April as the market rose from a low of $0.45 on April 1, 2018 to a high of $0.99 on April 24, 2018. This was a more than respectable price increase of 118%.
As the market began to roll over in May, price action had managed to find some minor support at the short term .618 Fibonacci Retracement (marked in black) at a price of $0.66. This is a Fibonacci Retracement taken from the bullish run experienced during April. However, the bearish pressure pushed prices lower until the market found support at the long term .886 Fibonacci Retracement (marked in red) at a price of $0.54, toward the end of May.
June started promisingly but this quickly turned into despair as price action continued to break below both the long and short term (red and black) .886 Fibonacci Retracements and further below Aprils low of $0.45 to where it currently trades at $0.43.
We can see that the market has found some form of support at a downside 1.618 Fibonacci Extension priced at $0.42. This is a Fibonacci Extension taken the initial bearish swing leg witnessed during May.
If price action can achieve support in this area and garner enough momentum to bring us back above April’s lows, then the nearest area of resistance comes in at the psychological round number of $0.50. A break above $0.50 would leave the market free to test resistance at the long term .886 Fibonacci Retracement priced at $0.54. If the bulls can push us even further then the next level of major resistance comes in at June’s high of $0.70.
Alternatively, if the market continues to pressure price below $0.40 then near term support can be found at $0.36 followed by $0.30.
The technical indicators are largely favoring the bears within this market. The RSI is trading well below the 50 handle and has been trading here for the majority of the previous 2 months. If we are to expect to see the bearish momentum to fade, we would like to see the RSI trade back toward the 50 handle and eventually break above it.
Let us continue to analyze how XRP has been trading relative to BTC in the recent period.
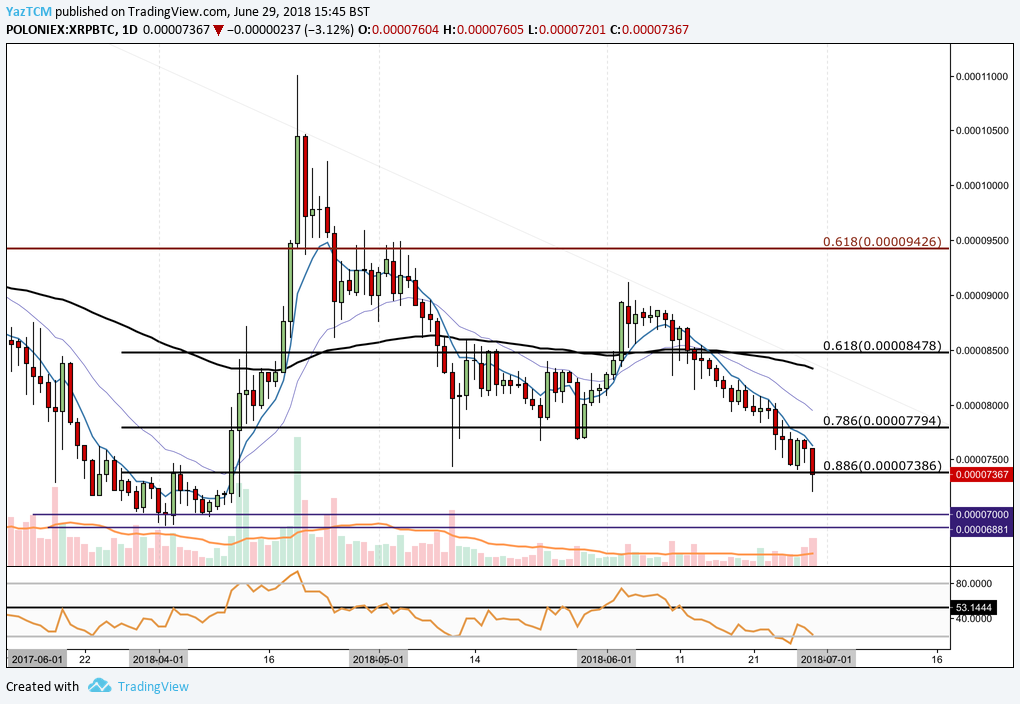
XRP/BTC – SHORT TERM – DAILY CHART
https://www.tradingview.com/x/QmPhhMWg/
Analyzing XRP performance relative to BTC, we can see that XRP had experienced a bullish run during April as price action rose from a low of 6,890 SATS on April 2 2018 to a high of 11,001 SATS on April 20th, a price increase of 58%.
Price action went on to depreciate during May, originally finding support on the .786 Fibonacci Retracement priced at 7,794 SATS before rebounding slightly. This is a Fibonacci Retracement taken from the bullish run outlined above.
June brought no joy to the bulls as price action eventually broke below 7,794 SATS to where it currently is trading at the .886 Fibonacci Retracement priced at 7,386 SATS. We can see that price action briefly spiked below this level but was sharply rejected.
If price action can continue to find support at this level, the nearest area of resistance is located at the .786 Fibonacci Retracement at a price of 7,794 SATS. Resistance following this comes in at 8,478 SATS which is the .618 Fibonacci Retracement followed by June’s monthly high of 9,114 SATS.
Alternatively, if the bearish sentiment continues, the nearest area of resistance comes in at April’s price low ranged between 7,000 SATS and 6,881 SATS (horizontal purple lines).
The technical indicators are also largely favoring the bears within this market. If we would like to see a price rebound, we need to see the RSI make its way back toward the 50 handle and break above it.
Conclusion
The entire crypto market has taken a beating with the majority of prices returning to their original levels before the enormous bull run experienced in December 2017 and XRP is no exception.
Over the past week Ripple has returned to a USD price low that has not been seen since December 2017. The good news is that relative to BTC, XRP has still yet to make these 7 month lows, indicating that the recent price drops are largely fuelled by Bitcoins recent price drops.
In bearish markets, it is important to stay rational and patient. With any investment, a game plan should already be in place so the investor knows at what price he needs to cut his investment short. It is important for the investor to stick to his game plan. On the flip side, these low price levels also provide opportunities for new investors to enter the market at preferable prices.
Related: 7 Altcoins to Invest in During a Bear Market