
OmiseGo has experienced another week of downward pressure as price action drops further by 16.95% over the past 7 trading days. OMG is currently trading around $7.74 per coin at the time of writing, falling almost 75% from the all-time high of $29.37 seen early January 2018.
OMG was created by its parent company, Omise, which is a company in Thailand dedicated to improving payment solutions across South East Asia. The team have come a long way since the coin was launched and have secured partnerships with many huge corporations including McDonald’s. OMG is aimed to be a user-friendly cryptocurrency helping users transfer money across Asia without the need for a bank account. For more information on OMG, refer to our What is OmiseGo? guide.
OmiseGo is currently holding a market cap rank of 20th across the entire industry with a market cap of $789 million. The market cap across all coins have taken a beating recently as total market cap has dropped by over $50 billion over the past 7 days alone. OMG has suffered a loss of $220 million in terms market cap depreciation over the past 7 days.
Although the markets may be down, the future still does look promising for OmiseGo. Joseph Poon, the co-creator of Plasma and the Lightning Network, helped to write OMG’s white paper. It is expected that OMG will be the first coin to implement Plasma upon their blockchain, which would allow scalability of smart contracts as the workload is taken off of the blockchain. The upcoming decentralized exchange should also add promise to the future of OMG. For a more detailed review on what to expect for OMG this year, check out our 2018 OmiseGo Roadmap article.
Let us analyze price action over the long term and see how the market has been trading.
Price Analysis
OMG/USD – LONG TERM – DAILY CHART
https://www.tradingview.com/x/hsblSLwr/
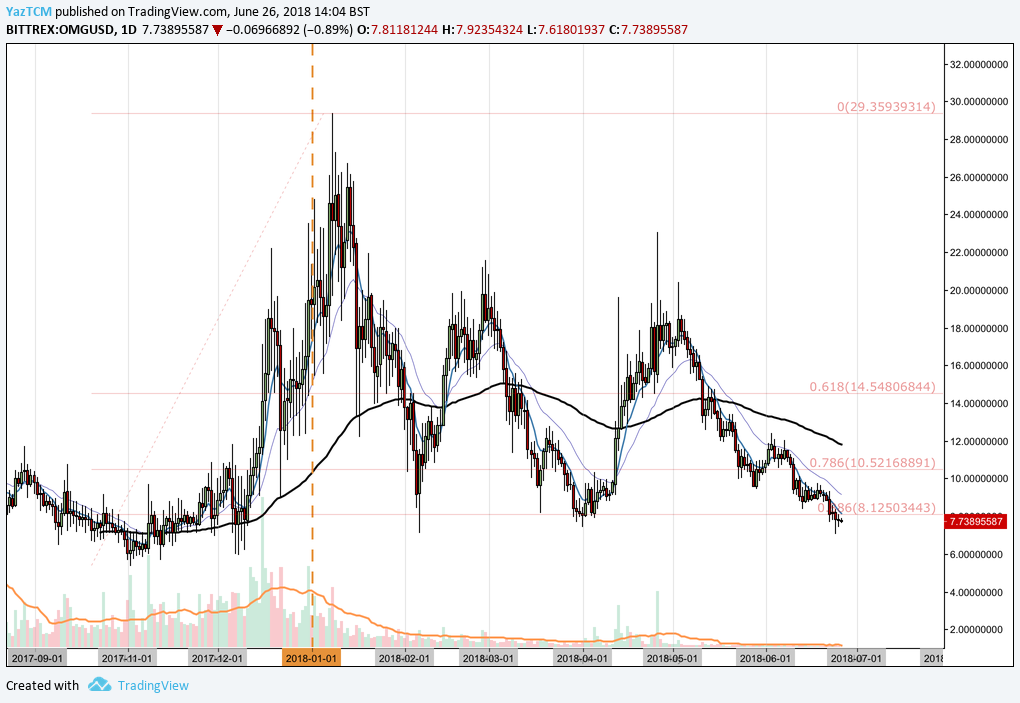
Analyzing the chart above, we can see that OMG has experienced a difficult year falling a significant amount from its all-time high of $29.37 in January. The cryptocurrency had experienced a major bullish run, like most other cryptocurrencies during this time, starting from a low of $5.37 on November 2, 2017 to a high of $29.37 experienced on January 8, 2018. This was an incredible bullish run amounting to a 450+% increase in price value.
Following this all-time high, price action proceeded to put in the yearly low on February 6, 2018 at a price of $7.11. This was also very close with the .886 Fibonacci Retracement of the major bullish run at a price level of $8.12. Since this low, price action has remained within a range bound by the yearly low and $20.
Price action has currently found its own way back around the .886 Fibonacci Retracement as it currently trades at 4-month lows of $7.73. Significant support has been seen in this area previously in February and in March/April. This has led to the formation of a potential triple bottom price pattern forming within the market so long as price can hold above $7.45. A triple bottom would mean $7.45 would act as support before price would rebound and become bullish once again.
Let us analyze this triple bottom and price action over the more recent period a little closer.
OMG/USD – SHORT TERM – DAILY CHART
https://www.tradingview.com/x/Pt4oaUFM/
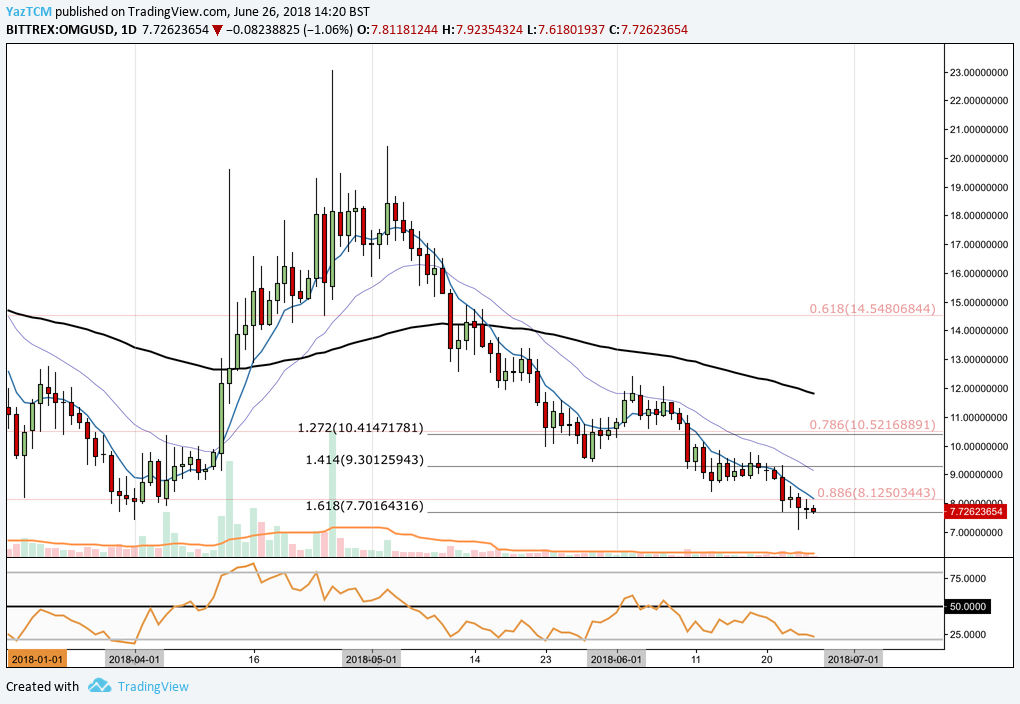
Analyzing the chart above, we can see that price action has found support at a 1.618 Fibonacci Extension at a price of $7.70. This is a Fibonacci Extension taken from the initial bearish swing leg experienced during the first half of May 2018.
If price action can hold above this 1.618 Fibonacci Extension level, this would constitute to the completion of the triple bottom (mentioned above) and a price rebound should be expected. In this scenario, the bullish pressure could push price action back toward near term resistance at the 1.414 Fibonacci Extension at a price of $9.30 followed by resistance met at the .786 Fibonacci Retracement at $10.52. If price action can break above this .786 Fibonacci Retracement then the market would be free to retest the monthly highs at a price of $12.40.
Alternatively, if the bearish pressure continues and price action breaks below the 1.618 Fibonacci Retracement, the next area of short-term support is located at $7. A break below the $7 would leave the next area of potentially strong support at December 2017’s low of $5.91.
The technical indicators are largely favoring the bears within this market. The RSI is trading well below the 50 handle and is approaching oversold conditions at the 20 handle. For the majority of the past 2 months, the RSI has remained in bearish sentiment trading below 50. For this bearish sentiment to show signs that it is slowing down, we would like to see the RSI make its way back toward and break above the 50 handle.
The 7-day EMA (blue line) and the 21-day EMA (purple line) are also trading within a bearish direction. We would like to see the 7-day EMA make its way toward the 21-day EMA and eventually cross up above it. Once the crossover occurs, this would indicate that the bullish pressure within the market has already begun to build.
Let us quickly analyze price action for OMG relative to BTC over the course of this year.
OMG/BTC – LONG TERM – DAILY CHART
https://www.tradingview.com/x/GZ4SG2fe/
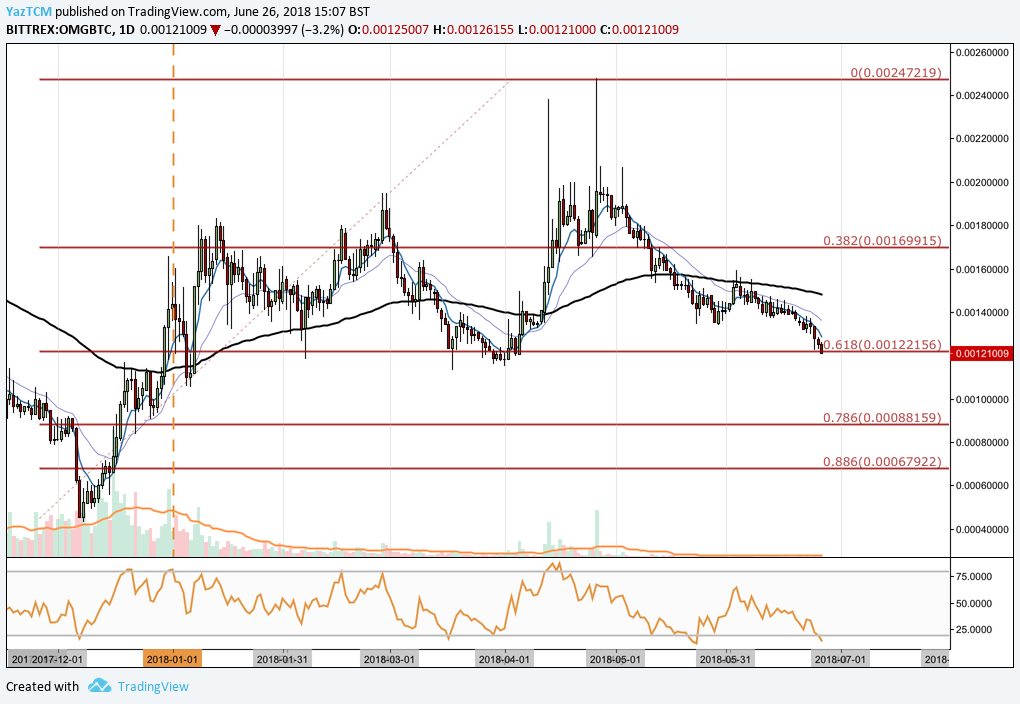
Looking at OMG’s performance relative to BTC, we can see that OMG has enjoyed the majority of the price appreciation.
OMG had experienced a bullish run in December 2017 as price action rose from a low of 43K SATS to a high of 183K SATS in January 2018. Price began to roll over in February, briefly putting in a new high at 195K SATS before falling again in March.
Price action then went on to make another bullish run during April as the market rose from a low of 115K to an all-time high of 247K. Since the placement of this all-time high, price action continued to depreciate during May and June. It currently has found some form of support at the .618 Fibonacci Retracement, taken from the entire bullish run seen from November 2017 to April 2018, at a price of 112K SATS.
If price action can hold above the .618 Fibonacci Retracement, this would help to form the triple bottom within the USD price chart and in turn allow bullish momentum to push prices higher. The nearest resistance for OMG/BTC comes in at the monthly highs of 159K. If price action can break above this it will be free to meet resistance further higher at the .382 Fibonacci Retracement priced at 169K SATS.
Alternatively, if the recent bearish pressure continues to build and the market falls below the .618 Fibonacci Retracement, we could expect the nearest level of support to come in at April lows at 115K SATS. Further long-term support beneath this level can be located at the .786 Fibonacci Retracement priced at 88K SATS.
Conclusion
OmiseGo has garnered a lot of support and partnerships across the short life span it has been trading. It is grounded through a solid payments solution team who were involved and dedicated toward payments solutions before OmiseGo was even created.
The market has taken a strong bruising over the past 30 days. However, price action has approached major support levels both against the USD and BTC. If the .618 Fibonacci Retracement can hold on the BTC charts, then the triple bottom should complete against the USD and a rebound should soon be expected to regain some of the losses recently experienced.