
- NEO/USD has established a strong level of support at the $15.50 handle.
- The bulls have been grinding price action higher as they currently trade at resistance provided at $18.47.
- Support Levels: $16.60, $16.00, $15.50, $15.00, $14.03.
- Resistance Levels: $18.47, $20.00, $24.37, $26.75, $30.00, $33.82.
NEO has seen a 5.78% price increase over the past 24-hour trading period. NEO/USD is now exchanging hands at a price level around $17.53, after seeing a further 7.54% price increase over the previous 7 trading days.
The 25-month old China-based “Ethereum Killer” is presently ranked 15th in terms of overall market cap relative to the whole cryptocurrency industry. It holds a total market cap of $1.12 billion after experiencing a viciously steep 52% price collapse over the past 90 trading days. NEO/USD is still trading at a value that is 89% lower than its all-time high (ATH) value.
Let us continue to analyze price action for NEO over the long term and see how the market has been behaving.
NEO Price Analysis
NEO/USD – LONG TERM – DAILY CHART
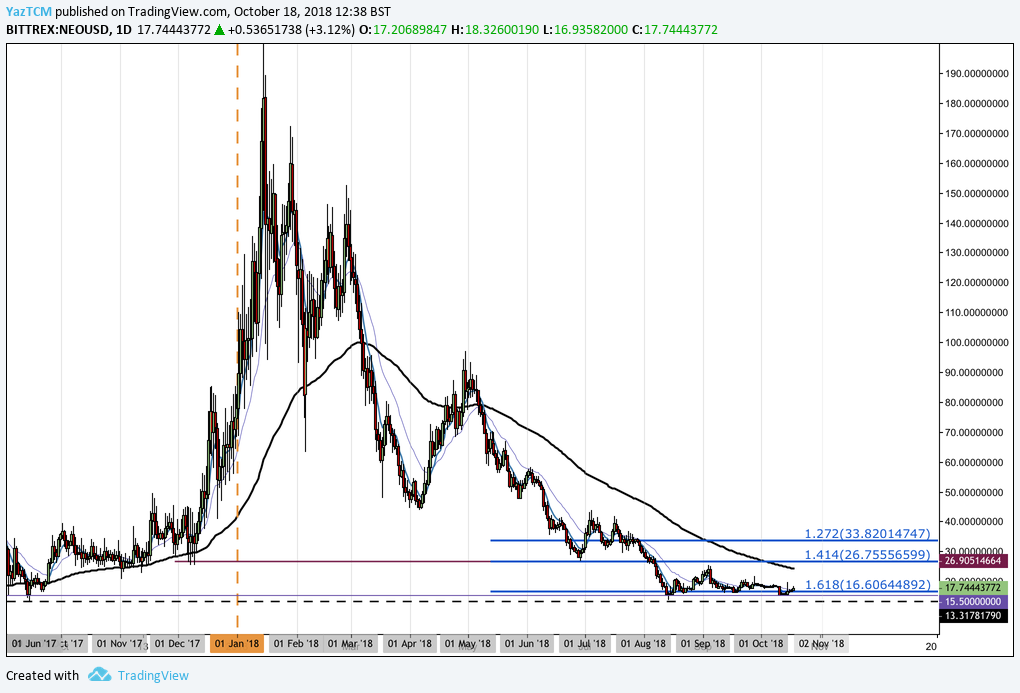
Looking at the market over the long-term period above, we immediately notice the epic bull run during December 2017. The market increased by a total of 641% as it began at a low of $25.51 on December 8, 2017, and continued to aggressively rally to an ATH value of $200.59 on January 15, 2018.
We can see that the trading year of 2018 has not been good for NEO/USD. After price action rolled over at the ATH price, the market has continuously dropped as the year has progressed.
Over the course of the previous 3 months, we can observe some form of relative stabilization for the NEO/USD market. Price action had approached support at a downside 1.618 Fibonacci Extension level priced around $16.60 during August 2018. As NEO/USD approached this level, the bears began to lose steam which allowed the bulls to maintain price action above the support level.
Let us continue to analyze the market over the shorter time horizon and highlight any potential support and resistance zones.
NEO/USD – SHORT TERM – DAILY CHART
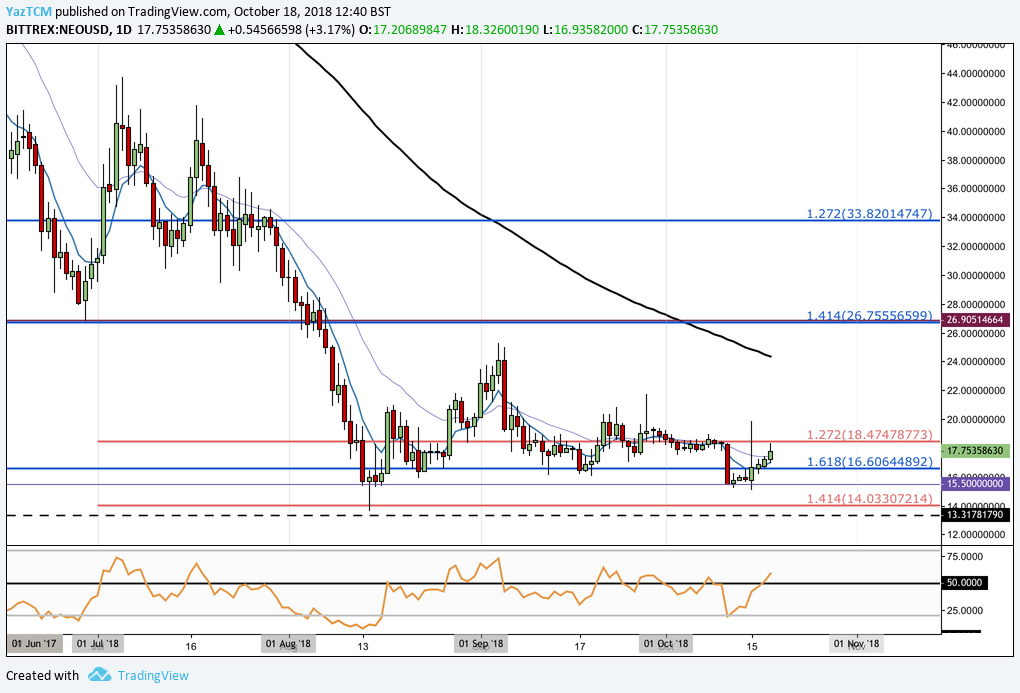
Evaluating the NEO/USD market over the previous 4 months, we can see that price action had met specific support at a short-term downside 1.414 Fibonacci Extension level (drawn in red) priced at $14.03 during August 2018. As the market reached this area of support, price action rebounded and has not yet ventured this low since.
We can also notice significant support at the psychological round number handle at $15.50 (horizontal purple line). We can see that this area has supported the market during August 2018 and October 2018, and can be considered a valid level of strong support.
NEO/USD is now trading at resistance provided by the short-term downside 1.272 Fibonacci Extension level (drawn in red) priced at $18.47. The market has been struggling to close above this level for the entire period of October 2018.
Moving forward, if the bulls can push NEO/USD above the resistance at $18.47, then we can expect immediate resistance above to be at the psychological round number handle at $20, followed by resistance provided by the 100-day moving average which is currently hovering around the $24.37 region.
If the bulls can continue to press price action for NEO/USD further higher, more resistance above can then be expected at the previous downside 1.414 Fibonacci Extension level (drawn in blue) priced at $26.75, followed by the resistance at the $30 round number handle. If the bulls press even higher, then resistance can be found at the downside 1.272 Fibonacci Extension level (drawn in blue) priced at $33.82.
On the other side of the equation, if the bulls fail to break above resistance at $18.47 and price action begins to fall, we can expect immediate significant support below to be located at the downside 1.618 Fibonacci Extension level (drawn in blue) priced at $16.60. Further support below this can then be expected at the support provided at the $15.50 handle, followed by support at the downside 1.414 Fibonacci Extension level (drawn in red) priced at $14.03.
The RSI technical indicator has recently started to produce a reading that favous the bulls after breaking above the 50 handle. If the RSI can remain above the 50 handle, this would indicate that the bulls are still in control of the market momentum, and we could expect NEO/USD to go higher.
Let us continue to quickly analyze price action for NEO/BTC over the short term and highlight any potential support and resistance areas.
NEO/BTC – SHORT TERM – DAILY CHART
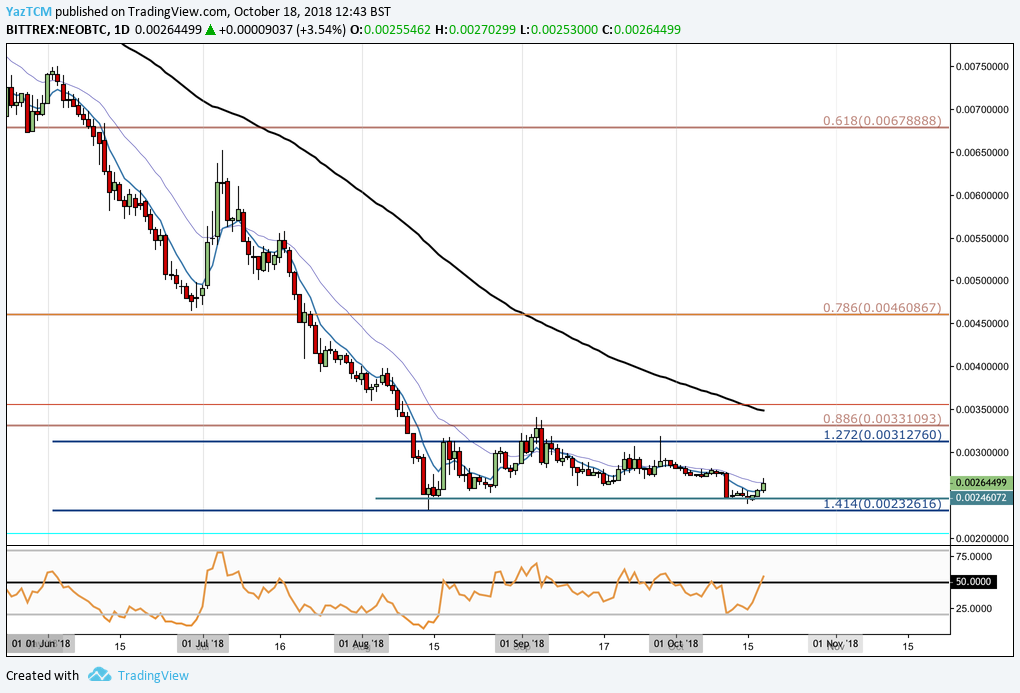
Analysing price action for NEO relative to BTC over the short period above, we can see that the previous market decline has started to show signs of relative stability over the past 3 months.
Price action had found support at a downside 1.414 Fibonacci Extension level priced at 0.00232616 SATS. As NEO/BTC reached this level of support, it had rebounded and began to trade sideways.
More specifically, the market has found a level of strong support that has been provided at the 0.00246072 SATS handle.
The stabilization of the market has caused NEO/BTC to trade sideways trapped within a range bound between 0.00232616 SATS as the lower boundary and the .886 Fibonacci Retracement level at 0.00331093 SATS as the upper boundary of the range.
If the bulls can re-establish themselves as the dominant force in the market and push NEO/BTC higher, we can expect immediate resistance above to be located at the upper boundary of the trading range. If they can break above the upper boundary, then further resistance can be located at the 100-day moving average which is currently hovering around the 0.00347946 SATS.
If the bulls can penetrate above the 100-day moving average, more resistance above can be expected at the .786 Fibonacci Retracement level priced at 0.00460867 SATS.