
Loopring has seen a significant 7.97% price decrease over the past 24 hours of trading. The cryptocurrency is currently exchanging hands at a price of $0.0923 after seeing a 3.41% price hike over the past 7 trading days.
Loopring is a decentralized exchange protocol that has an integrated autonomous exchange system. An ERC-20 token, the Loopring protocol allows users to trade assets over a range of crypto exchanges whilst maintaining complete control of their private keys from start to finish. This means no longer trusting your blockchain assets to 3rd party centralized cryptocurrency exchange which are vulnerable to targeted attacks.
It is important to point that out the Loopring is not a decentralized exchange. Instead it is a decentralized protocol, similar to 0x, that facilitates the decentralized exchange of blockchain assets.
However, 0x can only exchange Ethereum ERC-20 based tokens with each other, whereas Loopring can integrate with any blockchain that has a smart contract platform.
The Loopring protocol employs 2 technologies that allow for the facilitation of decentralized exchange. One is known as “Order Sharing” which splits individual orders into smaller pieces ready to be executed automatically to optimize trading results. The other technology is known as “Ring Matching” which increases the liquidity available for the Loopring Protocol.
Loopring is currently ranked 96th in terms of overall market cap across the entire industry. It has a total market cap value of $52.81 million after the 13-month old coin suffered a 71% price drop over the past 90 trading days. Loopring is currently trading at a price that is 95% lower than its all-time high price.
Let us continue to analyze price action for Loopring over the long term.
Loopring Price Analysis
LRC/USD – LONG TERM – DAILY CHART
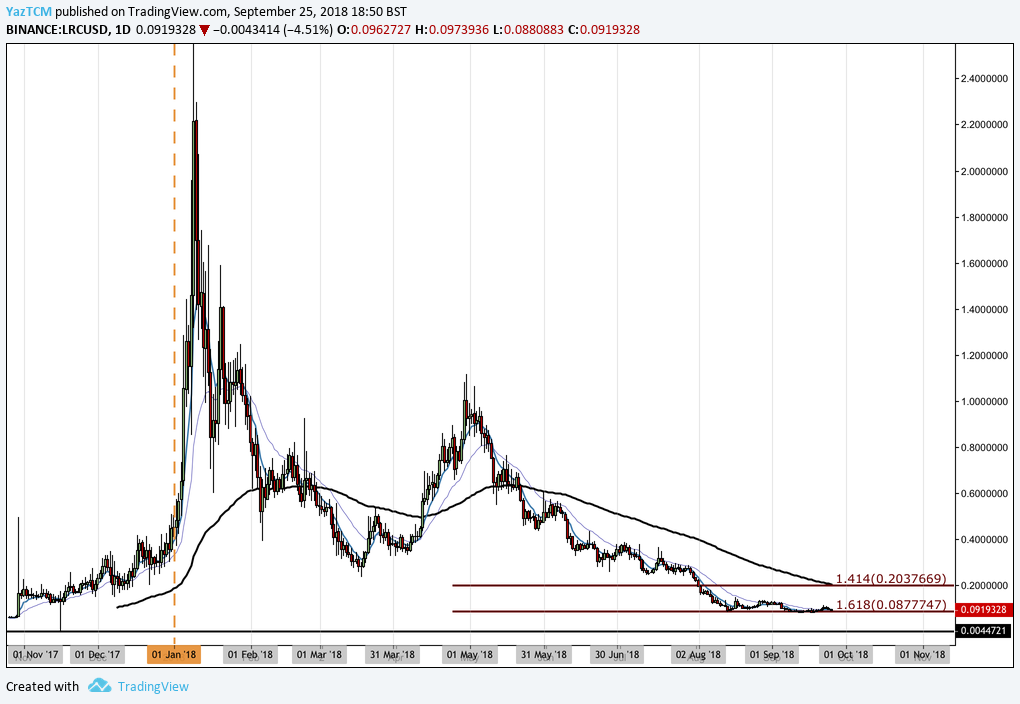
Analyzing the market from the long-term perspective above, we can see that Loopring has seen a significant bullish price run toward the end of 2017. Price action started from a low of $0.00141 on November 16, 2017 and extended to an all-time high price of $2.8713 on January 9, 2018. This was an epic bull run totaling over 5,000% from low to high.
We can see that after placing the all-time high the market rolled over and declined rapidly. It continued to fall through the majority of the year until finding some form of recent support provided by a downside 1.618 Fibonacci Extension level priced at $0.08777.
This level of support has helped stabilize the market over the past 2 months and is expected to hold moving forward.
Let us continue to analyze price action over the more recent term a little closer and highlight any potential further support and resistance zones.
LRC/USD – SHORT TERM – DAILY CHART
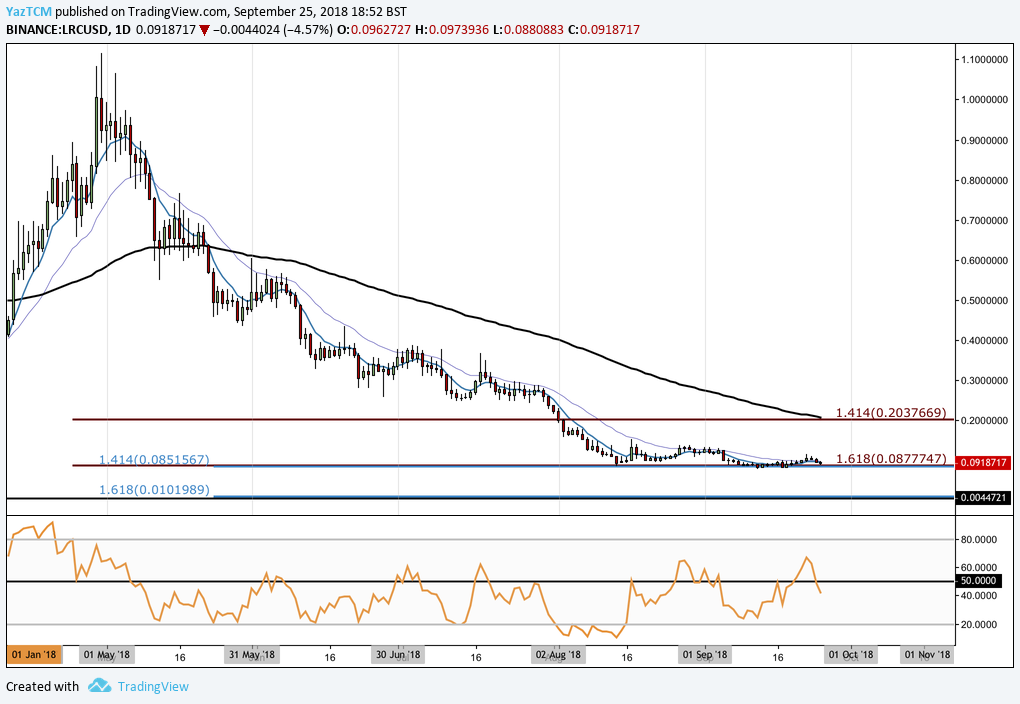
Analyzing the market from the short-term perspective above, we can see that price action has continued to fall for over 3 months before finding support at the downside 1.618 FIbonacci Extension level (drawn in brown) priced at $0.087 during August 2018.
This area of support was further bolstered by another downside 1.414 Fibonacci Extension level (drawn in blue) priced at $0.085. We can see that this combined area of support has helped to stabilize this market over the last 2 trading months.
The market has now established a trading range over the past 6 weeks between the $0.087 handle as the lower boundary of the trading range and the $0.14 handle as the upper boundary of the trading range.
Moving forward, if the bearish pressure increases and pushes the market below the lower boundary of the trading range at $0.087, then we can expect further support located below at the psychological $0.08. $0.075 and $0.07 handles.
If the market can break further below these Schelling points, then further support can be located at the downside 1.618 Fibonacci Extension level priced at $0.0101, although it is not expected that the market would ever drop this low.
Alternatively, if the bulls can regain the strength to push price action above the $0.10 handle and then further above the upper boundary of the trading range at $0.14, then we can expect immediate significant resistance higher to be located at the downside 1.414 Fibonacci Extension level (drawn in brown) priced at $0.0203.
This area of resistance will require significant momentum to overcome due to the 100-day moving average trading within this region, further bolstering the expected resistance here.
The technical indicators within the market are currently favoring the bears at this moment in time. The RSI has recently swung into the bears favor as it penetrated below the 50 handle, indicating that the bears are once again in control of the momentum within the market.
If we would like to see some gains for Loopring, we would need to see the RSI make its way back above the 50 handle to signal that the bulls are back in charge of the momentum.