
IOST has experienced a small 2.61% price hike over the past 24 hours of trading. The cryptocurrency is currently trading at $0.0206 after suffering a steep 10% decline over the past 7 trading days.
IOST is a relatively new project which launched on January 16, 2018, making the coin just 7 months old. It has been slated as a “next generation” blockchain, and a solution to the scalability problems currently plaguing the blockchain industry.
IOST uses a range of scalability proposed solutions to provide an on-chain blockchain which the team promises can achieve over 100,000 transactions per second.
One of the main features of the IOST blockchain is its Proof-of-Believability (PoB) consensus mechanism. This is a new style of consensus which creates 2 leagues of nodes that verify transactions on-chain: believable nodes and normal nodes.
The believable nodes quickly process transactions as fast as possible. The selection process to become a believability node relies on the nodes believability score which is a range of factors regarding token balance and reviews amongst other things.
After the believability nodes have processed some transactions, the normal nodes will then come and validate samples of the transactions and provide a level of verification to the transactions.
If the believability node is found to be dishonest, they will lose all their tokens in the node and their believability score will fall to 0. This mechanism creates a fairness algorithm that also allows for a great deal of transactions per second to be processed.
The IOST team has launched their testnet product in July 2018, and during the testing it was found that a significant 7000-8000 transactions per second was achievable on-chain.
To put this into perspective, the Bitcoin network can currently only handle a total of 7-10 transactions per second. Further advanced competitors, such as Ethereum, are still only able to process around 25 transactions per second.
Although the majority of blockchain projects are coming up with solutions regarding scalability, none have yet implemented these proposed solutions. IOST has proven that their blockchain can handle a huge throughput whilst maintaining the decentralized security of their blockchain.
IOST is currently ranked 54th in terms of overall market cap across the entire industry with a total market cap value of $172 million. The IOST market has significant losses to regain as price action has suffered a 69% drop over the past 90 trading days.
Let us continue to analyze price action for IOST over its short life span.
Price Analysis
IOST/USD – SHORT TERM – DAILY CHART
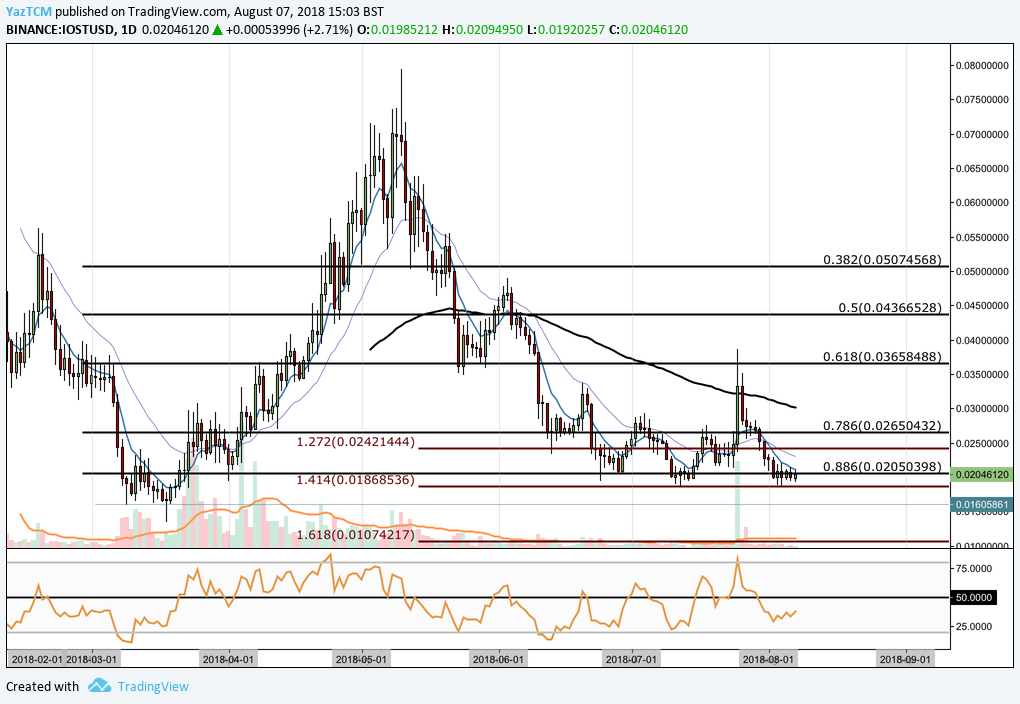
Analyzing the market from the short-term perspective above, we can see that IOST had experienced a significant bullish run during March/May when price action started from a low of $0.01346 on March 18, 2018 and extended to an all-time high of $0.07937 on May 10, 2018. This was a bullish rally totaling 460% from low to high.
After placing the all-time high, we can see that price action started to roll over. It initially found support at the .618 Fibonacci Retracement priced at $0.03658 toward the end of May. This Fibonacci Retracement is measured from the entire bullish run outlined above.
The market, however, was not able to sustain this level and continued to fall during June, briefly finding short-lived support at the .786 Fibonacci Retracement level priced at $0.02650.
Price action fell further below this level until sustained support was found at the .886 Fibonacci Retracement level priced at $0.02050. We can see that this level had provided significant support during July and continues to provide support during August.
It is important to highlight that the downside 1.414 Fibonacci Extension, priced at $0.01868, has provided the critical support level. Each time the market dips toward this level, it is strongly defended by the bulls.
This pivotal Fibonacci Extension is measured from the entire bearish swing witnessed during May 2018. Going forward, this will be a crucial support level to watch, as a break below could lead to further price declines.
If the bears do manage to push price action below the 1.414 Fibonacci Extension level, we expect immediate support to be located at the low day close price for March priced at $0.01605, followed by the downside 1.618 Fibonacci Extension level priced at $0.01074.
Alternatively, if the bulls can garner enough momentum from this support level, we expect immediate resistance to be located at the downside 1.272 Fibonacci Extension level priced at $0.02421, followed by the .786 Fibonacci Retracement level priced at $0.0265.
Resistance above this area is expected at the 100-day moving average which is currently hovering around the $0.03 handle.
The technical indicators are currently heavily favoring the bears as the RSI trades well below the 50 handle. If we are to see a price rally, we will need to see the RSI break above the 50 handle and continue to slowly rise.
Let us continue to analyze price action against Bitcoin over the same time period.
IOST/BTC – SHORT TERM – DAILY CHART
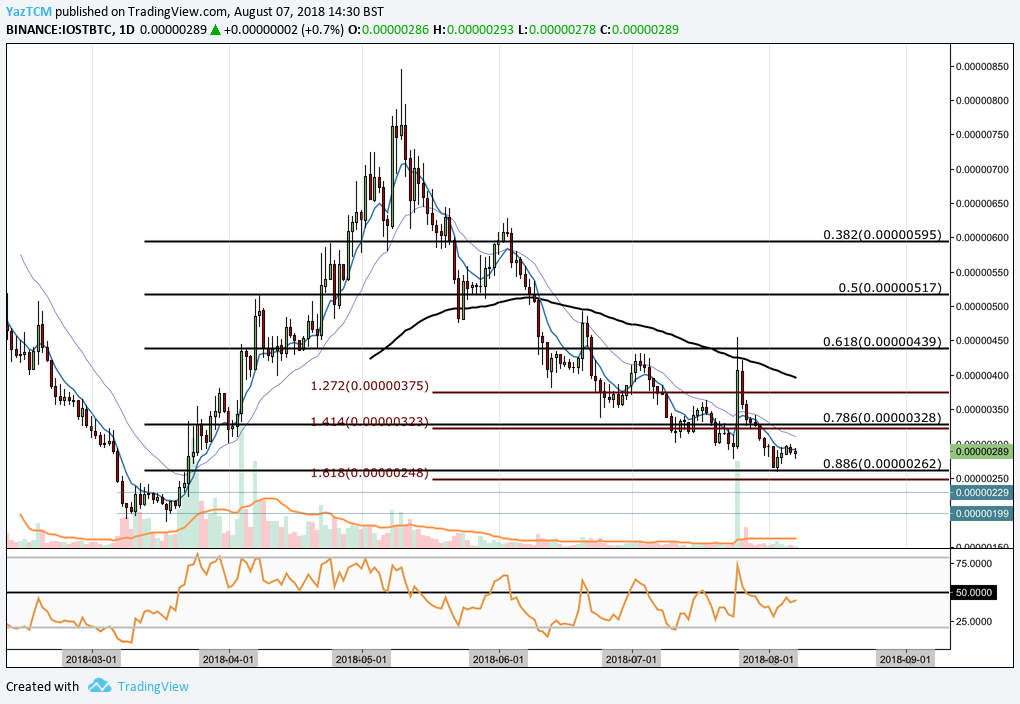
Analyzing the market relative to Bitcoin, we can see that IOST had experienced a price hike when price action started from a low of 186 SATS on March 18, 2018 and extended to an all-time high of 845 SATS on May 10, 2018. This price increase totaled 340% from low to high.
We can see that price action rolled over after placing the all-time high, initially finding support at the .5 Fibonacci Retracement priced at 517 SATS during May. This Fibonacci Retracement is measured from the entire bullish run aforementioned.
The market continued to drop lower, finding support at a downside 1.272 FIbonacci Extension priced at 375 SATS in June. As July started to trade, we can see that price action managed to hold support at the .786 Fibonacci Retracement priced at 328 SATS for the majority of the month.
This support level was bolstered by the downside 1.414 Fibonacci Extension which was priced in the same area. However, the market fell further lower towards the end of July to find support at the .886 Fibonacci Retracement priced at 262 SATS.
If the bears continue to push price lower, we expect immediate support to be located back at the .886 Fibonacci Retracement, at 262 SATS, followed by the downside 1.618 Fibonacci Extension priced at 248 SATS.
Support below this level is expected in a strong “demand” zone which ranges between 229 SATS and 199 SATS. If the market approaches this level, we expect a wave of buying to occur here.
Alternatively, if the bulls can pick up steam within the market, we expect immediate resistance to be located at the .786 Fibonacci Retracement priced at 328 SATS.
Further resistance above this area can be expected at the 1.272 Fibonacci Extension priced at 375 SATS, followed by the 100-day moving average which currently hovers around 400 SATS.
The RSI is approaching the 50 handle, indicating that the bearish momentum is fading within the market. If it can break above 50, we can expect the bullish momentum to increase within the market.
Related: Solving Blockchain’s Biggest Problem: 5 Projects Working on Scalability