
EOS has suffered a further week of losses as the price of the cryptocurrency tumbled 26% over the past 7 trading days. The crypto giant is currently trading around $7.63, at the time of writing, and is down 2.98% over the past 24 hours alone. This comes a short 2 weeks after the EOS mainnet blockchain launch brought ample confusion.
EOS was founded by Dan Larimer in 2017. It was intended to become the most powerful infrastructure for decentralized apps and set to become an Ethereum killer. A new protocol, different from Ethereum, that could scale horizontally and vertically, allowing for growth as the network grows. To find out some more about EOS, check out our article, “What is EOS.”
EOS had raised over $4 billion in its year-long ICO and is currently ranked 5th in terms of overall market cap across the entire industry, with a market cap of $6.89 billion. This is down from $9.67 billion from June 21 by over $2.8 billion.
The price drop comes after the rocky start to EOS’s mainnet blockchain launch combined with governance confusion. Just 3 days after the launch, Block Producers (BPs) of EOS were instructed to freeze 7 accounts that had been involved in phishing attacks during the launch. 5 days later, the BPs were further instructed to freeze 27 more accounts. These decisions were ridiculed among hardcore cryptocurrency fanatics who claimed that the BPs have too much of a ruling hand.
Let us analyze price action over the course of the year.
Price Analysis
EOS/USD – LONG TERM – DAILY CHART
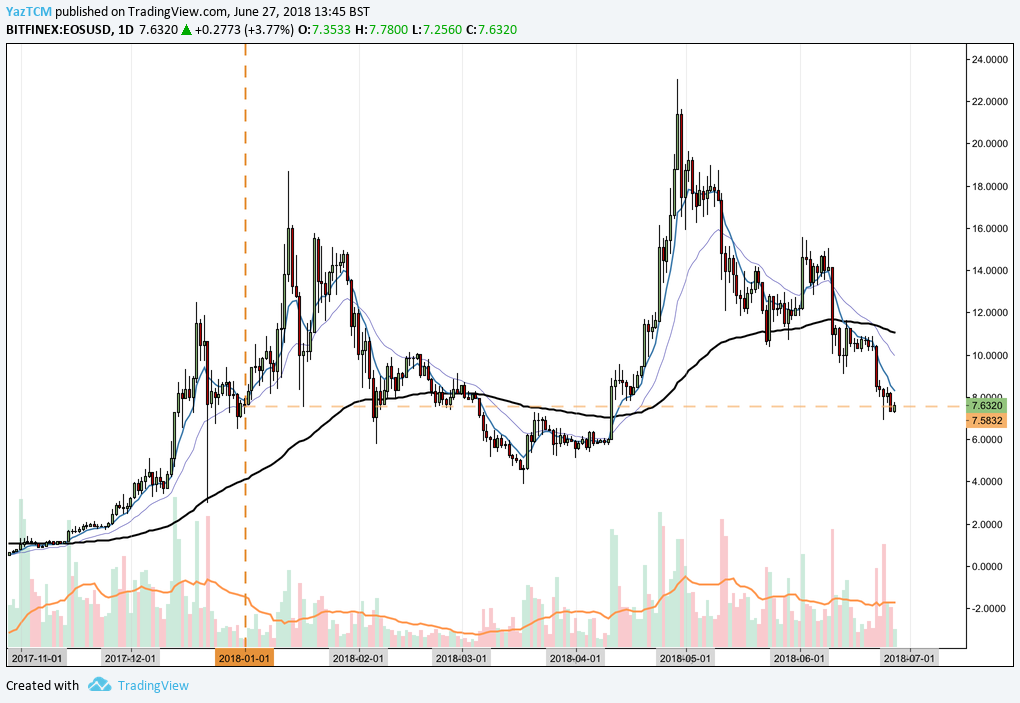
https://www.tradingview.com/x/LQqq73sx/
Analyzing the market from the long-term perspective above, we can see that EOS experienced a bullish run during December 2017 and January 2018, as price action rose from a low of $5.10 on December 1 to a high of $18.67 on January 13. This was an epic price increase of 560%.
Since placing the high in January, price action went on to depreciate past the yearly open at $7.58, until reaching a low of $3.87 in March. During April, price action went on to create another bullish run, rising from a low of $5.10 on April 1 to a high of $23.02 on April 29, another 360% increase in price from low to high.
During May and June, price action began to roll over and depreciate to where it is currently trading, marginally above the yearly open, at a price of $7.63. We can see that the yearly open has provided an area of support from price action previously in January and February.
Let us analyze price action over the more recent term a little closer.
EOS/USD – SHORT TERM – DAILY CHART
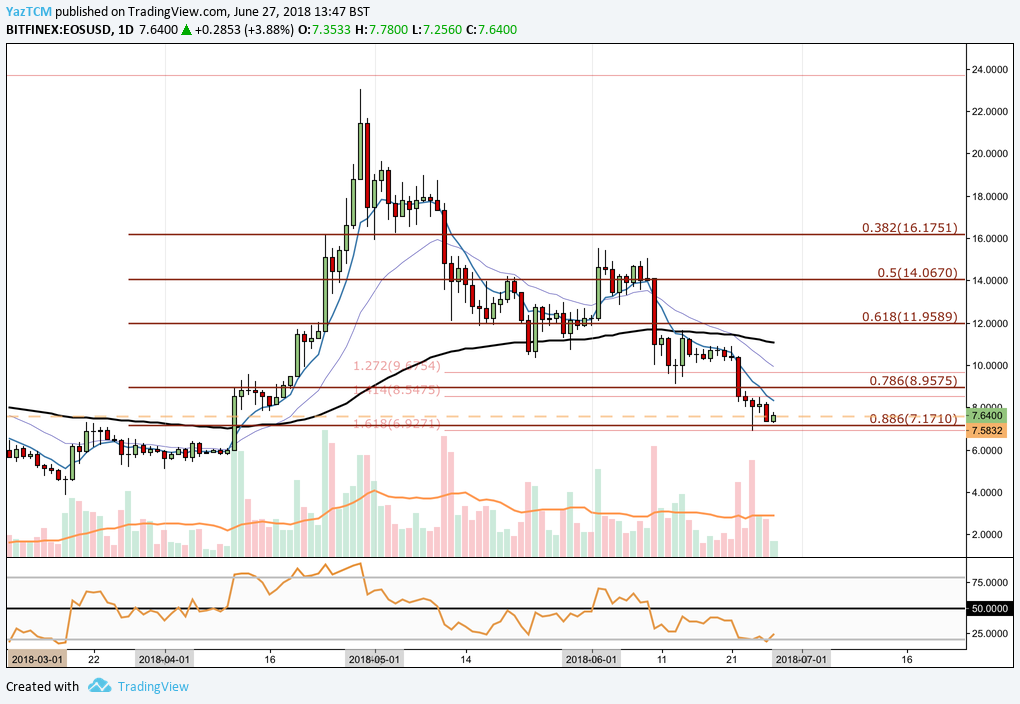 https://www.tradingview.com/x/bScnvsJR/
Analyzing price action over the more recent period, we can see the bullish run during April more clearly. After placing the all-time high at $23.02, price action began to roll over and found support at the .618 Fibonacci Retracement during May at a price of $11.95. This is a Fibonacci Retracement taken from the entire bullish run seen during April.
The Fibonacci Retracement and is a popular tool amongst technical traders within every different market. The tools is based off of Leonardo Fibonacci’s famous mathematical sequence. The tool takes two extreme points and then creates support and resistance levels drawn at each Fibonacci ratio as the market ‘retraces’ or goes down. The Fibonacci Extension is similar however, it takes three extreme points and creates extension Fibonacci levels that the market could potentially hit if the trend continues.
As June came alone, price action dropped below the .618 Fibonacci Retracement, momentarily finding support at a downside 1.272 Fibonacci Extension priced at $9.67. This is a Fibonacci Extension taken from the first bearish leg experienced during May. The market eventually broke through this level of support and right through the .786 Fibonacci Retracement priced at $8.95 to where the market is currently trading at $7.64.
We can see that price action has found some support 3 sessions prior at the .886 Fibonacci Retracement priced at $7.10, which also coincides with the downside 1.618 Fibonacci Extension priced at $6.92.
The market is currently finding resistance at the year’s opening price. If the bulls can overcome this level, they would leave price action free to test the .786 Fibonacci Retracement once again, priced at $8.95. If the bullish momentum could take us further higher, resistance comes in at the .618 Fibonacci Retracement priced at $11.95. If the bulls can breach this level, this would allow the market to retest the June high at $15.54 at some point during July.
Alternatively, if price action falls below $7, and consequently below the .886 Fibonacci Retracement priced at $7.17, then the nearest level of support could potentially be located around $5.60, which served as strong support during April. Further support following this comes in at $3.87 which is 2018’s yearly low.
The technical indicators are in strong bearish territory at this moment in time. The 7-day EMA (blue line) is on a steep decline and price action is trading well below this line. For an indication that the bearish momentum is beginning to fade within the market we will for the 7-day EMA to cross up above the 21-day EMA (purple line).
Similarly, the RSI is trading in extreme oversold conditions around the 20 line. The RSI has traded below the 50 handle for the majority of the past 2 months and shows no signs that it wants to break above. If the RSI does begin to approach the 50 handle and eventually break above 50, this should indicate that the bullish momentum is beginning to pick up within the market.
Let us analyze how price action has been trading relative to Bitcoin in the recent term.
EOS/BTC – SHORT TERM – DAILY CHART
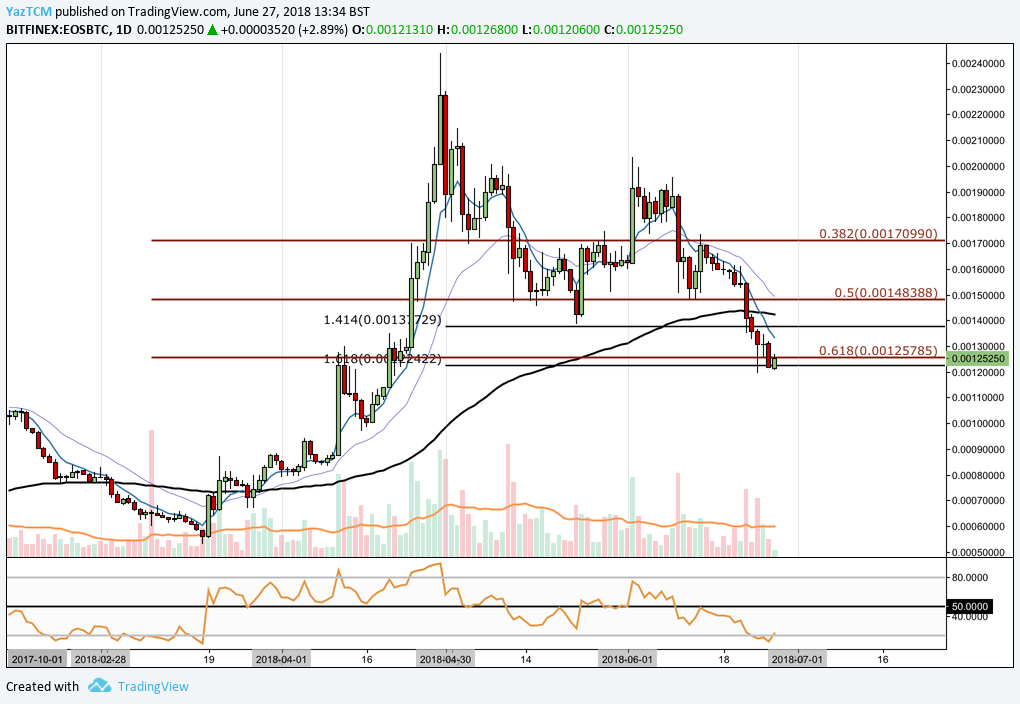 https://www.tradingview.com/x/YjH4AidV/
Analyzing price action against Bitcoin, we can see that EOS had experienced a bullish run against Bitcoin starting from a low of 52K SATS on March 18 to a high of 243K SATS on April 29. This was an impressive 350% increase in price from low to high.
After placing this all-time high of 243K SATS, price action went on to fall during May, eventually finding support at the .50 Fibonacci Retracement priced at 148K SATS. This is a retracement of the bullish run seen during March and April. Price action rebounded at this level only to fall once again as June came around. The market plummeted, further breaking through the .50 Fibonacci Retracement to find support at the .618 Fibonacci Retracement priced at 125K SATS.
Price action has also found support at a 1.618 Fibonacci Extension taken from the initial bearish leg seen during May, at a price of 122K SATS. If price action can manage to hold this level then the nearest level of resistance to the upside is found at 137K SATS which is the 1.414 Fibonacci Extension, followed by 148K SATS which is the .50 Fibonacci Retracement.
Alternatively, if the bearish pressure continues and price action drops below the .618 Fibonacci Retracement, then the nearest level of support is located at 100K SATS followed by 93K SATS which is the .786 Fibonacci Retracement of the bullish run seen during March and April.
The RSI is also trading in oversold conditions within this market. For the bearish pressure to subside we will look for the RSI to make its way back toward and eventually break above the 50 handle.
Conclusion
After such an enormous ICO sale, it is expected that a project with EOS’s scope will experience some bumps along the way.
However, even after such a shaky start to the mainnet of EOS, the potential future of EOS is as firm as it ever was. Bear market notwithstanding, as the development continues and dapps are eventually introduced to the network, this crypto giant is likely to grow alongside its protocol.
Related: 6 Reasons to Invest in EOS (Opinion)