
Cardano has suffered a price drop totaling 8.45% over the past 24 hours of trading. The cryptocurrency is currently exchanging hands at a price of around $0.1576, at the time of writing and has suffered a further 9.66% loss over the past 7 trading days (relative to the USD).
Cardano was created by Charles Hoskinson and was the first peer-reviewed cryptocurrency blockchain to ever be rigorously and formally audited by academics worldwide. They are developing a smart contract and dapp platform that will rival previous platforms available, such as Ethereum. The network can boast superior transaction speeds relative to Ethereum, and is also coded in a more secure form of code known as Haskell.
Cardano has received much excitement due to Hoskinson being a familiar figurehead within the industry. He used to be CEO and co-founder of Ethereum, working with Vitalik Buterin, but left to pursue other ventures.
For more information on what Cardano is and the history of the project, we recommend reading “What is Cardano.”
Cardano is currently ranked 8th in terms of overall market cap across the entire industry, with a total market cap value of $4.09 billion. ADA, the cryptocurrency behind Cardano, has witnessed a strong 23.64% increase over the past 30 trading days.
Let us continue to analyze price action for Cardano over the short term and highlight any potential support and resistance zones.
Price Analysis
ADA/USD – SHORT TERM – DAILY CHART

https://www.tradingview.com/x/oLWcZ9Sr/
Analyzing the market from the short-term perspective above, we can see that ADA had experienced a price hike during April 2018 when price action started from a low of $0.13 on March 30, 2018 and rose to a high of 40.38 on April 29, 2018. This is a price hike of 190% from low to high.
The market could not sustain this level and rolled over from this high set in April. This area also contained the 100-day moving average adding to the resistance experienced in this area. The market went on to drop during April and May 2018, falling below the March’s lows to find support at a 1.272 Fibonacci Extension priced at $0.11. This Fibonacci Extension is measured from the entire bearish swing leg witnessed during May 2018.
Since hitting support at the 1.272 Fibonacci Extension, the market reversed and made a bullish run until hitting resistance at a short-term 1.618 Fibonacci Extension priced at $0.19. Price action is currently up a total of around 38% from this low seen in June.
If the bullish momentum continues within the market, we expect near-term resistance to be immediately located at the $0.20 handle which is the psychological round number barrier. However, it also contains the 100-day moving average within the same price level, adding to the expected resistance here. Further resistance can be located at the .382 Fibonacci Retracement priced at $0.21.
Alternatively, if the market rolls over once again, we can expect near-term support to be located at $0.14 followed by $0.12.
The RSI indicator is currently in favor of the bears within the market, dropping slightly below the 50 handle. If we are to expect the bullish momentum to pick up again, we would need to see the RSI break above 50 and continue to rise toward overbought conditions.
Let us continue to analyze ADA/BTC over the long and short term to highlight any potential areas of support and resistance.
ADA/BTC – LONG TERM – DAILY CHART
https://www.tradingview.com/x/pQsOucnC/
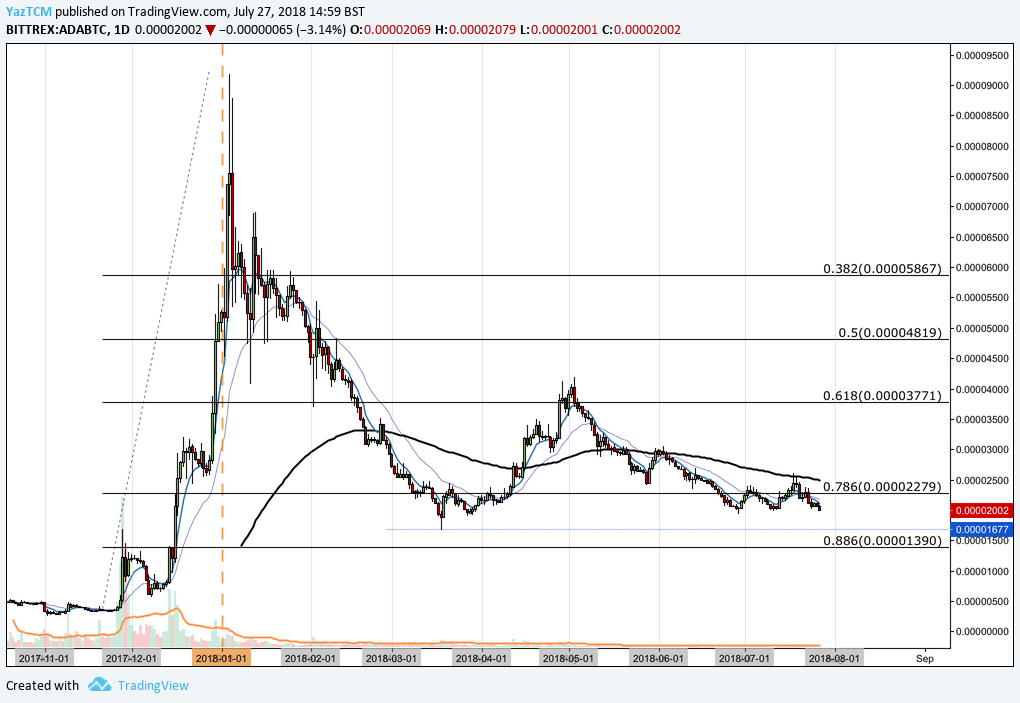
Analyzing the market relative to Bitcoin over the long term above, we can see that ADA had experienced an extraordinary price increase when it started from a low of 330 SATS on November 24 ,2017 and rose to an all-time high of 9,180 SATS on January 4, 2018. This was an epic rise totaling 2,745% from low to high.
We can see the market was not able to hold this level as it dropped, initially finding support at the .50 Fibonacci Retracement level priced at 4,819 SATS. This is a Fibonacci Retracement measured from the bullish run aforementioned.
The market continued to decline through February and March, falling below the .618 Fibonacci Retracement and the .786 Fibonacci Retracement to find support at around 1,677 SATS. This level became the price low for 2018, so far.
Let us continue to analyze price action over the shorter period to highlight any potential support and resistance zones.
ADA/BTC – SHORT TERM – DAILY CHART
https://www.tradingview.com/x/R8bFEZSW/
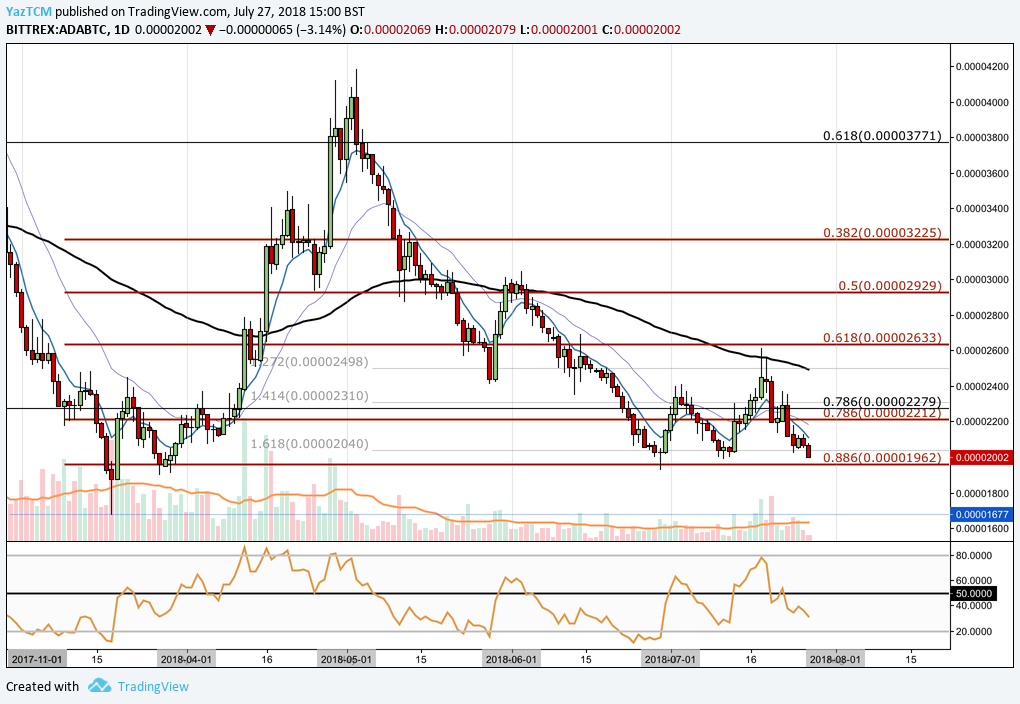
Analyzing the market from the short-term perspective above, we can see ADA had experienced another bullish run during April when price action started from a low of 1,673 SATS on March 18, 2018 and extended to an intermediary high priced at 4,184 SATS in May 3, 2018. This was a price increase of 150% from low to high.
We can see that price declined during May, falling below the short term .618 Fibonacci Retracement priced at 2,633 SATS. This is a Fibonacci Retracement measured from the bullish run outlined in the paragraph above. Price action continued to fall during June until it found support at a 1.618 Fibonacci Extension priced at 2,040 SATS.
Price action is currently trading at this level. If the bearish pressure continues, we expect near-term support to be located at the .886 Fibonacci Retracement priced at 1,962 SATS. Following support below this level is expected at the March lows priced at 1,677 SATS.
Alternatively, if the bulls can pick up steam once again, we expect near-term resistance to be located immediately at the short-term and long-term .786 Fionacci Retracements (both in the same area) around 3,320 SATS. Further resistance above this level is expected at the 100-day moving average which currently hovers around 2,500 SATS.
The technical indicators in this market are also favoring the bears at this moment in time. The RSI is currently trading below the 50 handle, indicating that bearish momentum is in play. For a bullish run, we will need to see the RSI break up above the 50 handle.
Similarly, the moving averages are all pointing in a bearish trajectory. For a bullish run to occur, we would need to see the 7-day EMA (blue line) make its way toward the 21-day EMA (purple line) and cross above it for a bullish crossover signal. This would indicate that the bullish pressure is building within the market.
Related: Turning Theory into Reality: Progress and the Future of Cardano