
The cryptocurrency markets experienced another month of downward pressure in terms of market cap on a whole. The total market cap of all coins fell from a high of $470 billion in early May, to a low of $303 billion near the end of the month.
For “altcoin season” to occur over the next few months, Bitcoin and alternate cryptocurrencies will need to overcome some significant levels of resistance in the month of June.
However, the markets have primed themselves for some bullish momentum in June. Will this momentum continue to and lead to increased prices?
Bitcoin Suffers Another Bearish Month, But Are Bitcoin’s Woes Nearly Over?
May 2018 proved to be a difficult month for the bulls of BTC. Bitcoin started the month well, reaching a peak of $9,990. However, BTC then dropped by almost 30%, reaching a low of $7,040.
Recent price action has suggested that the potential for a short-term reversal is quite likely, as price makes an attempt at the upper resistance line of a long-term symmetrical triangle.
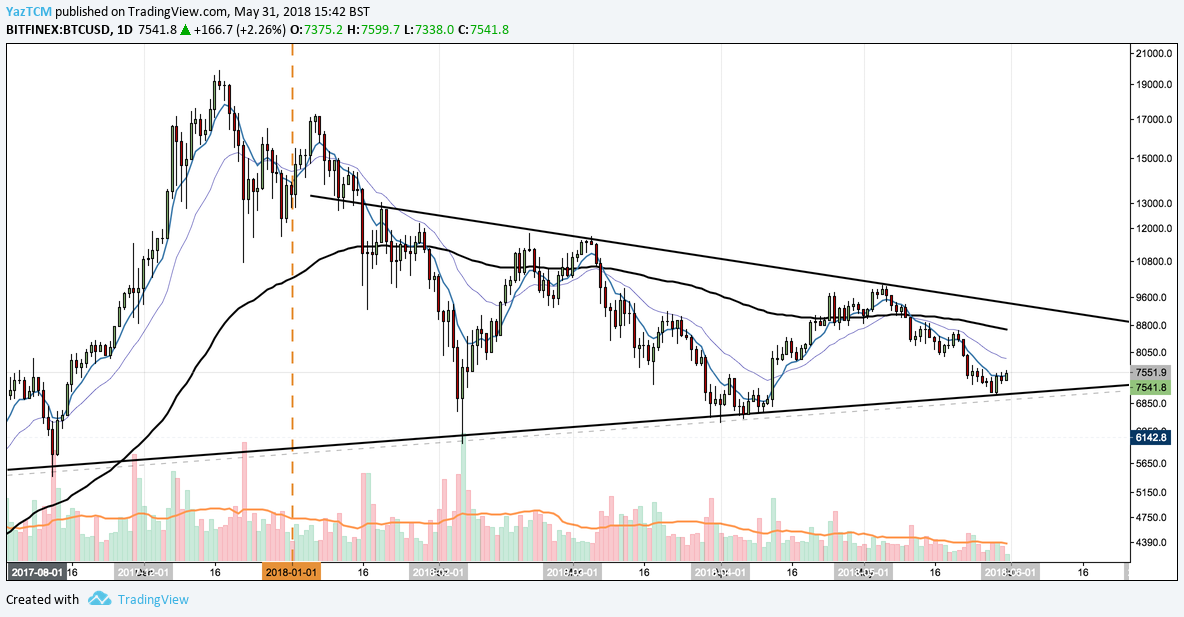
BTC/USD Price Analysis – Long-Term Overview
BTC/USD – 1 Day Chart –
Are we trading in a bullish or bearish market condition?
From a long-term perspective, Bitcoin is neither trading in a bullish or a bearish trading condition. Instead, the market has elected to trade within a period of consolidation, specifically within the range of a symmetrical triangle as shown in the chart above.
BTC has been trading within this symmetrical triangle since mid-January 2018 for a period of just over 4 months. We can see that price action begins to make a series of lower highs and higher lows typical of a colidtation period.
For the market to be considered as a bullish market, price action would have to break above the upper resistance line of the symmetrical triangle, then confirm strength by holding above the $10,000 price level.
For the market to be considered a bearish market, price action would have to break below the lower support line of the symmetrical triangle. Price would then make an attempt for a triple bottom around the $6,560 region.
In consolidating markets it is best to wait on the sidelines before making long term plays. Traders should wait for price strength confirmation before making any significant trading decisions.
For those on the sidelines, price is steadily approaching the apex of the triangle. This is a signal that a significant move may be near, whether it be a strong bullish break above the triangle or a sudden bearish fall below the triangle. Either way, traders do not have long to wait for the resolution of this technical pattern.
Short-Term Overview – Daily
BTC/USD – 1 Day Chart –
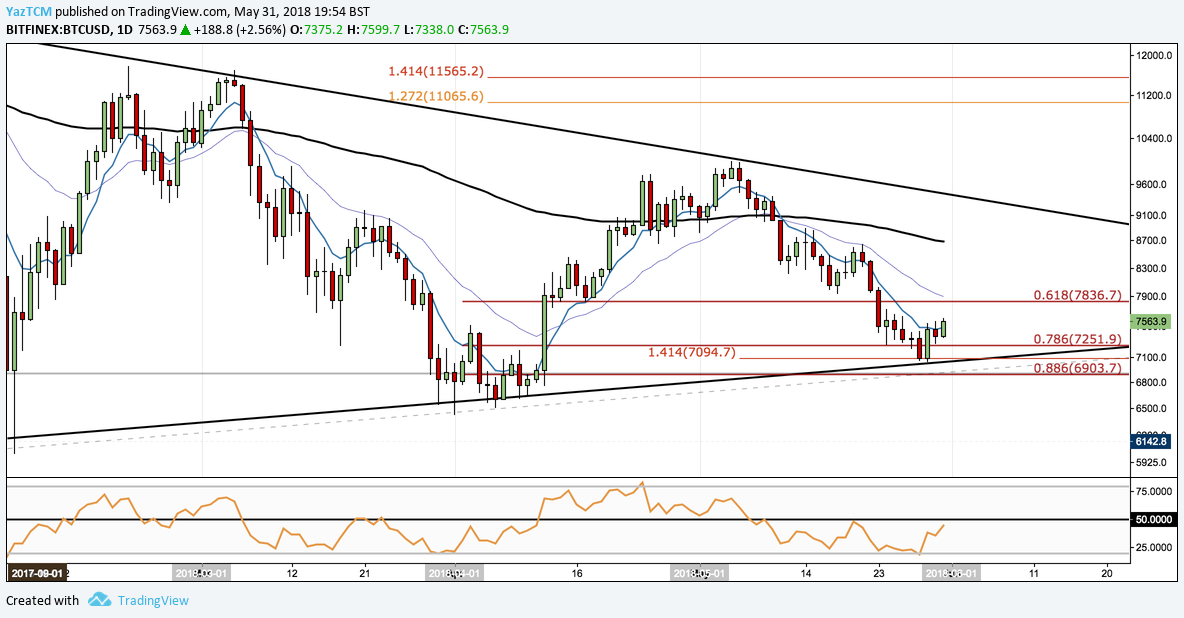
Are Bitcoin’s bearish problems nearly over?
From the chart above, we can see that Bitcoin has recently found some significant support in the region between the .786 Fibonacci Extension at $7,251, and the downside 1.414 Fibonacci Extension at $7,094. It is also important to note that the reversal came as price action approached the lower support boundary of the long-term symmetrical triangle.
The past 3 trading days have been very bullish, if price action manages to continue then we can expect BTC to retest the .618 Fibonacci Retracement level at $7,836 before rallying further to the upper resistance boundary of the triangle. June 2018 could prove to be a promising month for Bitcoin bulls if price manages to continue on the course it has previously created. If price action does manage to break above the triangle then we could see a $14,000 BTC in the coming months.
The RSI indicator is showing promising signs that a bullish month could be on the way. If RSI manages to break and hold above the 50 handle, it would indicate a bullish environment. Lastly, if price can close above the 7-day EMA then a positive spell of momentum may be approaching.
Short-Term Overview – 4-Hr
BTC/USD – 4-Hr Chart –
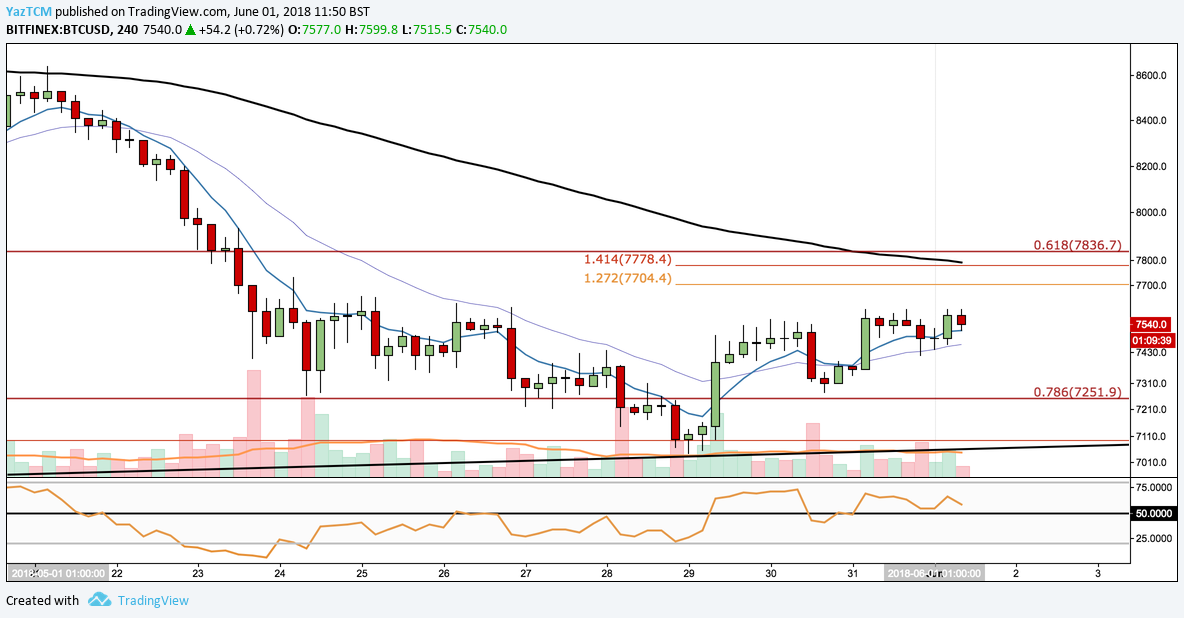
Upon taking a closer examination of price, we can see that Bitcoin may not be out of the bearish cycle just yet. The last few candles show that Bitcoin may be struggling to break above $7,600 as price has been rejected at this level at each time it has previously made an attempt to.
If price does manage to break above $7,600 then we may expect price to continue upwards towards $7836 with potential resistance around $7,704 and $7,778 along the way.
The technical indicators are also showing some promising signs for the bulls within the 4-hr period. The RSI is fighting to stay above the 50 handle and our shorter term EMA’s are both pointing in the bullish direction.
We will be following the price closely over the first few days in June before committing to any long term trades.
EOS – Remains Range-Bound Ahead of Mainnet Launch
EOS, the crypto-token that managed to raise over $4 billion through their ICO, has performed well over the past few months, relative to other cryptocurrencies. At the time of writing, the crypto giant sits comfortably at 5th in terms of market cap, with a value of over $11 billion and a token price of $12.45.
With its complicated mainnet approaching, EOS traders are staying close to the market anticipating the next move. Due to the uncertainty surrounding the mainnet launch, it could take EOS a few weeks to find price strength. It is important to remain patient and let price action dictate where the market is next heading.
EOS/USD Price Analysis – Overview
EOS/USD – Daily Chart
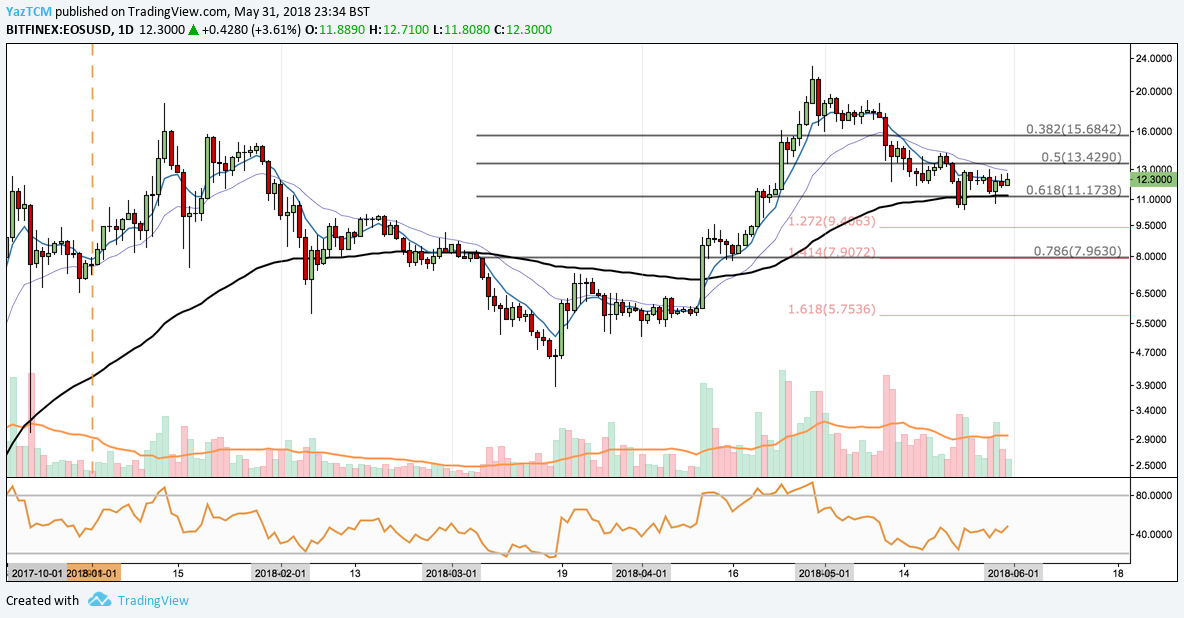
We can see that EOS started the year trading around $7. Since the opening of the year, EOS reached the yearly low around mid-March at $3.87. From this low point price began to garner some bullish momentum and increased in price by over 400% from the low, to a high of over $23.02.
May has proven to be a tough month for EOS holders. This is expected as investors become fearful to invest during uncertain times such as major fundamental updates like a mainnet launch. Price action has fallen but has already returned up to the .618 Fibonacci Retracement level, taken from the previous bullish run, at a price of $11.17.
Over the past 8 days, price has been trading in a range-bound condition between the .618 Fibonacci Retracement ($11.17), and the .5 Fibonacci Retracement ($13.42).
The technical indicators are showing signs that price action may have found some significant support at this level and might be ready to continue its ascension. Price appears to have found support on the 100-day SMA and RSI is battling its way up above the 50 handle.
If the bulls react promisingly toward the markets mainnet launch by breaking above the .50 Fibonacci Retracement level, then we could expect bullish momentum to take us above $15.68 and then on to test the ATH priced at $23.02.
Alternatively, if prices drop below the $10 level, then we may expect a deeper retracement for EOS against the USD, possibly down to the .786 Fibonacci Retracement around $7.96.
EOS/BTC Price Analysis – Overview
EOS/BTC – Daily Chart
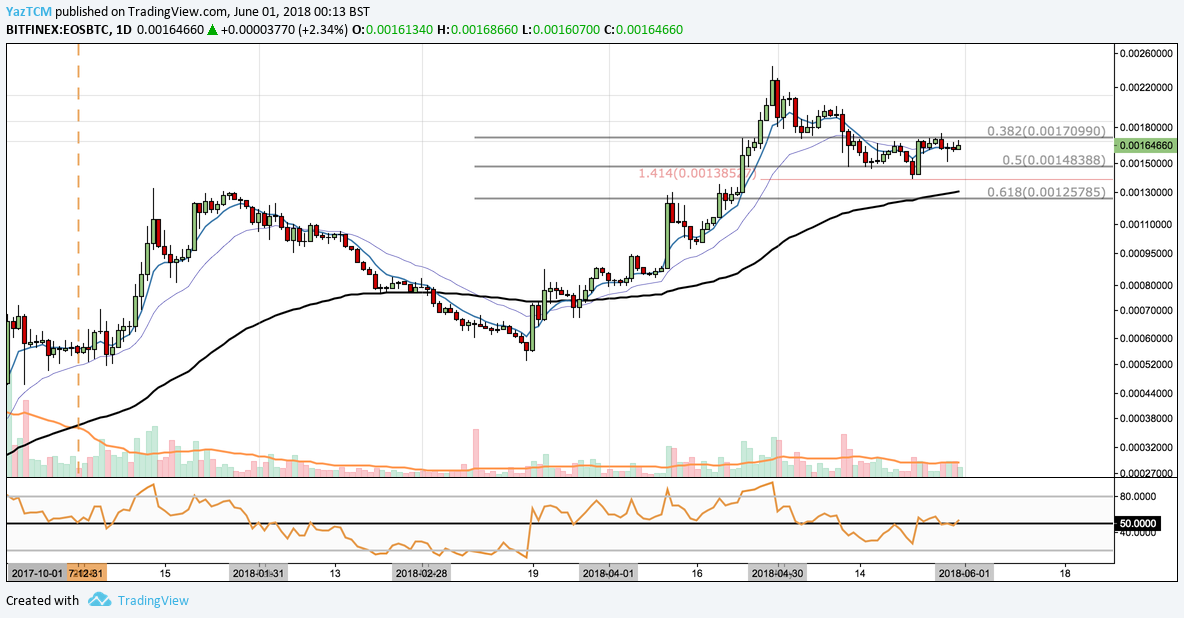
From a long term perspective, we can see that EOS has been enjoying significant gains against BTC. The pair has started the year at a price of 55k SATS and is trading currently at 161k SATS, an extreme rise in price.
Price action has retraced down to the .50 Fiboacci Retracement level at a price of 148k SATS, before a slight rebound. Since then EOS has been trading within the .5 and .382 Fibonacci Retracement region at a price of 148k SATS to 170k SATS respectively.
For a bullish run to occur within this market we would expect price action to break above 170k STATS then garner support above the same mark. If EOS can find new support about 170k STATS, then we could a retest of the all time high time at 243K SATS.
From the chart above, we can see that the technical indicators are showing major signs of indecision. The RSI has maintained a strong balance across the 50 handle indicating a struggle occuring between the bulls and the bears with neither side finding any momentum.
As the market waits for the outcome of this long anticipated maintnet launch, it appears the market will remain indecisive. This is not surprisingly considering the uncertainty surrounding the token exchange from ERC-20 to Mainnet.
Tron – Prices Struggling to Hold After a Lackluster Response to the Mainnet Launch
Markets did not respond in a bullish fashion after a much anticipated mainnet launch for the TRX token. Instead, price action dropped slightly to a low of $0.056, before returning around $0.060 at where it is currently being traded at the time of writing.
May has been a very turbulent month for the TRX token. The market had opened the month at approximately $0.093, just below the all-time high (ATH) of $0.10. However TRX failed to continue the bullish momentum set out in April. At the time of writing, the TRX is down 35% over the past 30-days and sits comfortably in 10th position according data from www.coincheckup.com.
TRX/USD Price Analysis –
TRX/USD – Daily Chart – Long Term
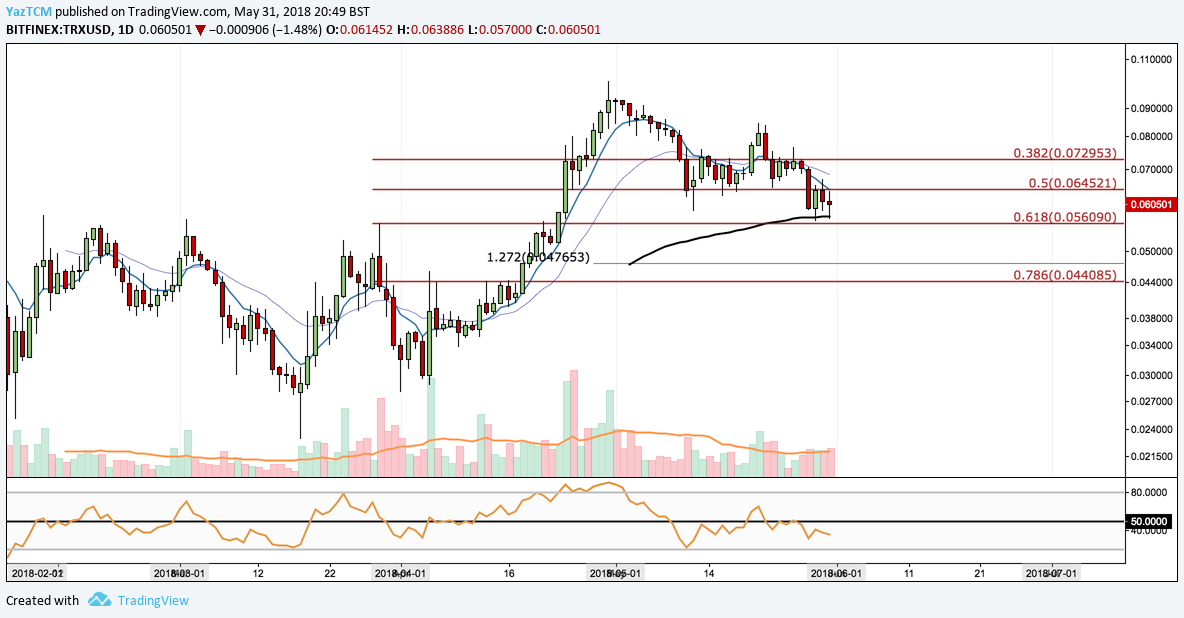
Tron had experienced a major bullish run, against the Dollar, in the month of April reaching an ATH of up to $0.10. Since then the market had began a slow unwind and is approaching the .618 Fibonacci Retracement level at a price of $0.056.
If price manages to fall below $0.056 then June may turn out to be a sour month for TRX holders as this would indicate a possible drop to the $0.047 region.
Alternatively, if the bulls manage to push price above the .50 Fibonacci Retracement level, at a price of $0.064, then prices may continue upward.
RSI is currently under 50, indicating that the current trend may be predominantly bearish for the time being. However, over the past 3 days price action has found support just above the .618 Fibonacci Retracement, on the 100-day SMA, marked as the rising black line. If price can hold above the 100-day SMA and RSI can make its way above 50, then we can expect some promising signs from TRX.
TRX/USD – 4-Hr Chart – Short Term
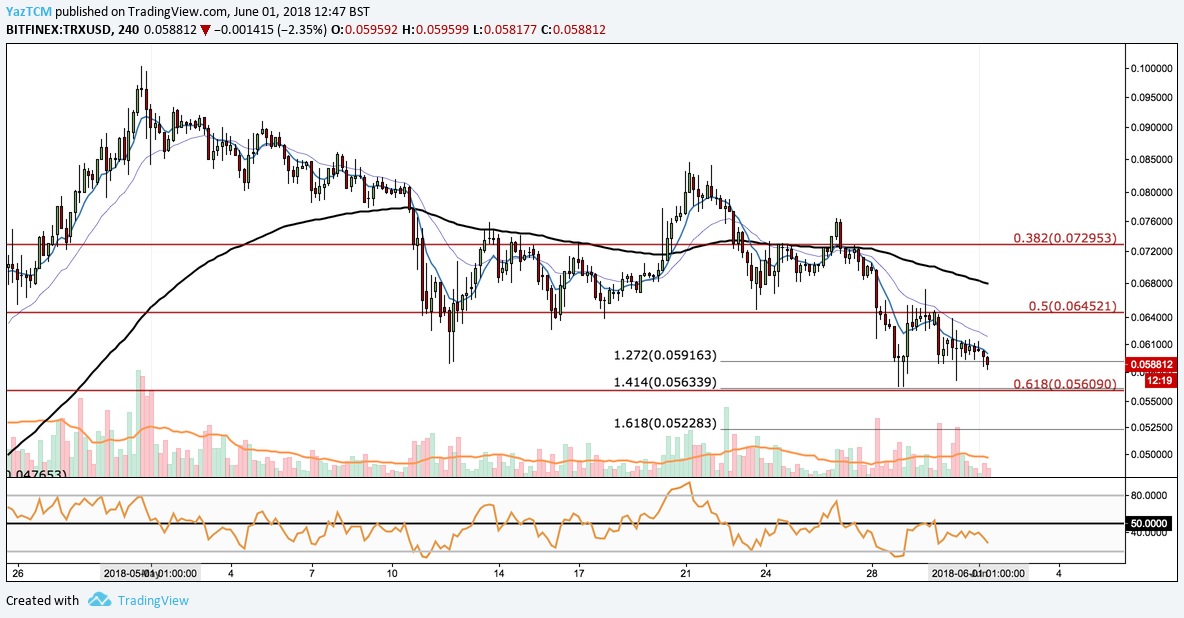
From a short term perspective, we can see that the market is still trading within the confines of the .5 and the .618 Fibonacci Retracement. Price action has found some stability on a downside 1.272 Fibonacci Extension taken from the initial swing down from May 21 up until May 23, at a price of $0.059.
If price action can hold above the long term .618 Fibonacci Retracement then we can expect some more sideways trading for the first week of June. However, if price eventually manages to break below the .618 then we could see more bearish action in the following days. The next level of support following the .618 Fibonacci Retracement is located around $0.052.
On a short term basis, all of our technical indicators are suggesting that markets are trading in a bearish direction as the RSI is consistently below the 50 threshold and all of the moving averages indicators are pointing downward. For this brief spell of bearish momentum to end we would need to see the moving average indicators crossing as well as RSI breaking above the 50 level.
TRX/BTC Price Analysis
TRX/BTC – Daily Chart – Long Term
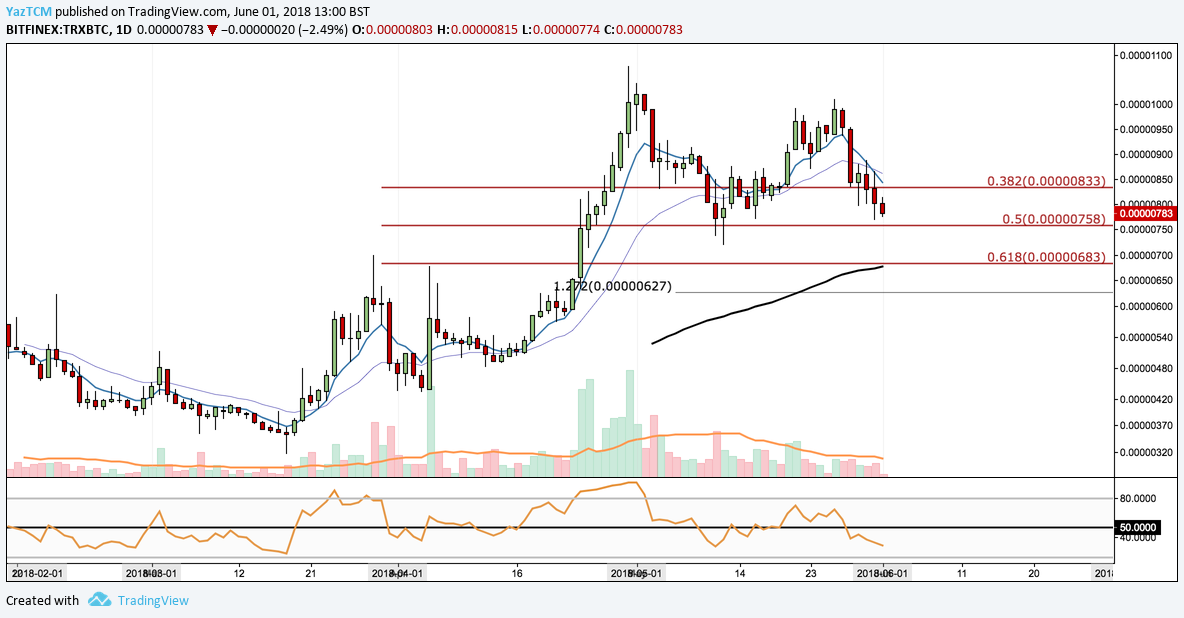
TRX grew significantly against BTC in April. However, toward the end of May TRX gave back much of those gains. TRX started the month at a high of 0.00001043 (1,043 SATS) but is currently trading around 780-800 SATS as the start of a new month approaches.
If price continues in a bearish manner during June, we can expect the TRX token to head lower and possibly garner support around the .50 Fibonacci Retracement level around 758 SATS. Price action could head toward the .618 Golden Fibonacci Retracement level of 683 SATS where support would be expected.
Alternatively, if price action can find support at the .50 Fibonacci Retracement level then we may see the formation of a double bottom and signal the start of a bull run where we could see TRX testing the previous months highs.
The technical indicators on this chart show signs of a strong bearish market. RSI is well below the 50 threshold indicating the downward momentum and the 7-day EMA has crossed below the 21-day EMA indicating a possible shift in trading condition toward the downside.
TRX/BTC – 4-Hr Chart – Short Term

From a short term perspective, we can see that TRX has been struggling over the past few days against BTC, falling from the highs of over 1K SATS to the current lows at around 785 SATS. Tron is currently down 5% over the past 24-hours and down 18% over the past 7 days.
Price has currently found support at the downside 1.618 Fibonacci Extension level located at 776 SATS. However, this level of support is insignificant is not expected to hold. Price could head lower but hopefully garner support at the .5 Fibonacci Retracement level.
RSI and the moving averages would need to show some positive signs to hope for any short term bullish momentum. RSI is consistently below 50 and all of the moving averages are pointing downward and pulling away from each other, indicating that the recent strong bearish momentum will continue.
Looking Forward
Markets have not responded promisingly to the mainnet launch, however, the bulls are hoping the $4 billion worth of TRX raised in the ICO will transfer into value on the mainnet. With the launch of Odyssey 2.0 Tron claims they can process up to 10,000 transactions per second, dwarfing most other blockchains. If Tron can achieve this throughput, it will be interesting to see how markets will respond.
Golem – Making Progress In May
The distributed supercomputer, Golem (GNT), has experienced some significant gains over the past week. The coin had started the beginning of last month, April, at a price of $0.20, before rallying and reaching its recent high in early May at a price of $1.03.
Golem, at the time of writing, is currently sitting at rank 37 in terms of market cap and is trading within the $0.60 region. GNT has experienced significant gains of about 37% over the past week.
GNT is an ERC-20 token designed to be used as fuel within the global Golem decentralised supercomputer. Users with spare processing power can loan resources out to those that require the extra computing power.
In April the team released its much anticipated beta product known as “Golem Brass.” This proof-of-concept product, which is live on Ethereum’s mainnet, allows users to experiment with Golem Brass during the processing stages of their Blender projects.
Golem has also received some significant support from major cryptocurrency exchanges within the past couple of months. The crypto exchange giant, Binance, has recently added the GNT token to their listings along with one of Korea’s largest exchanges, Bithumb.
GNT/USD Price Analysis – Long-Term Overview
GNT/USD – Daily Chart
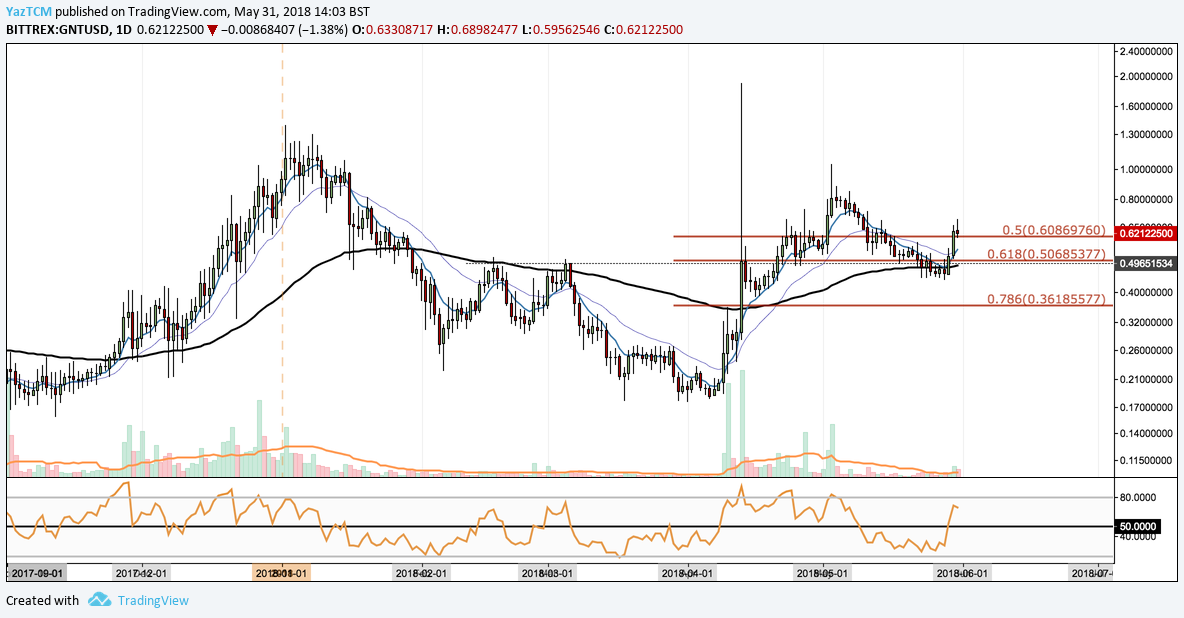
From a long term perspective, Golem has followed the same market cycle prevalent throughout the entire altcoin ecosystem.
From the chart above, we can see that the token had experienced a major bullish run during the the months of November 2017 and December 2017, starting the run from a price of $0.15 per GNT and continuing the bullish momentum to the high reached at the start of this current year at $1.38. After reaching this high, GNT began to roll over and experience a bearish period that spanned 3-months as prices dropped from the January highs of $1.38 to recent low set on April 1, 2018 at a price of $0.17.
During the month of April, the same month that Golem launched Golem Brass on Ethereum’s mainnet, the GNT token had experienced over a 300% increase in price. At one point, price managed to spike above the $1.88 handle, although it was only able to hold this level for a short period of time.
Currently, during May 2018 and early June 2018, Golem has been trading through a narrow retracement of its previous bullish move. We can see that price had retraced just below the .618 Fibonacci Retracement level at a price of $0.50, but the bulls managed to hold this level and is currently trading higher within the region of $0.62.
From a long-term perspective, if Golem can continue on its bullish trajectory then we would first like to see a break of the $0.82 before GNT can go on to retest the highs set in January 2018.
Alternatively, if Golem’s bullish momentum falters and manages to close below $0.50, we could expect the price of GNT to fall toward a deeper .786 Fibonacci Retracement level at a price of around $0.36.
GNT/USD – Daily Chart – Short Term Overview
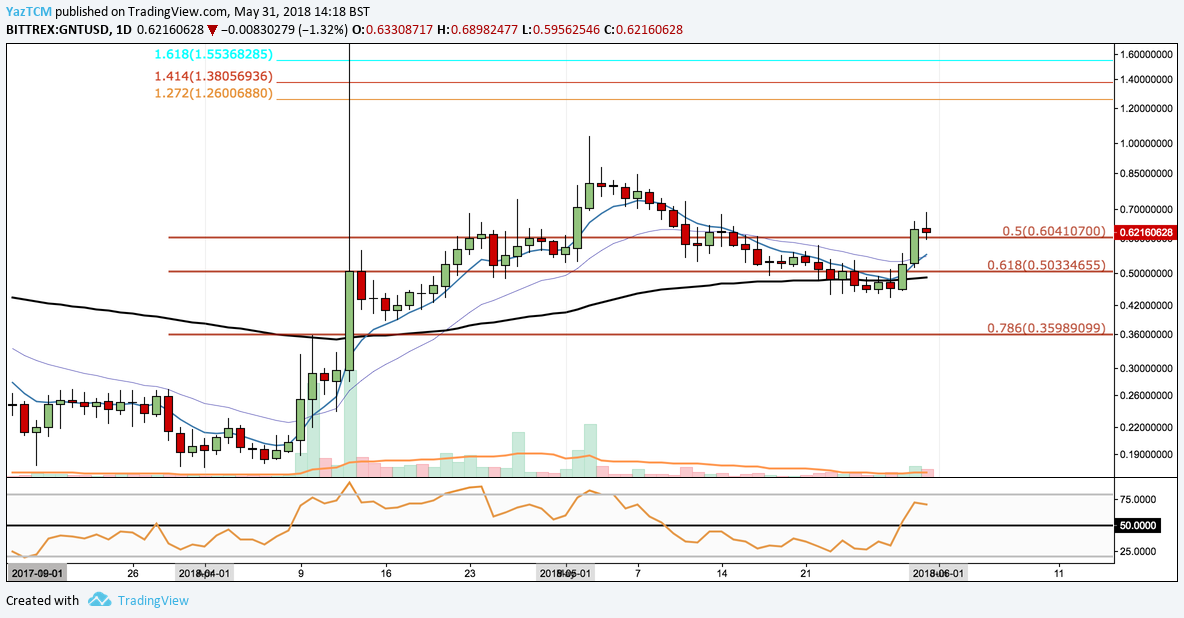
May 2018 proved to be a bearish month for Golem as prices dropped around 57% from the month’s high of $1.03 down to the month’s low of $0.43. However, over the past 2 trading days, price has managed to make a relatively decent recovery as it battles its way above the .50 Fibonacci Retracement at $0.60.
At the time of writing, all of the technical indicators are showing promising signs for GNT against the USD.
RSI, the Relative Strength Index, has managed to creep above the 50 handle indicating that the previous bearish momentum may be finished. We will be closely watching RSI over the next few days to see if it manages to remain above 50.
The Moving Average indicators are also once again starting to point in the upward direction as the 7-Day EMA is beginning to cross above the 21-Day EMA. If these EMA’s manage to cross and pull away from each other then we can take it as a positive indicator for the bulls within the market.
GNT/USD – 4Hr Chart – Short Term
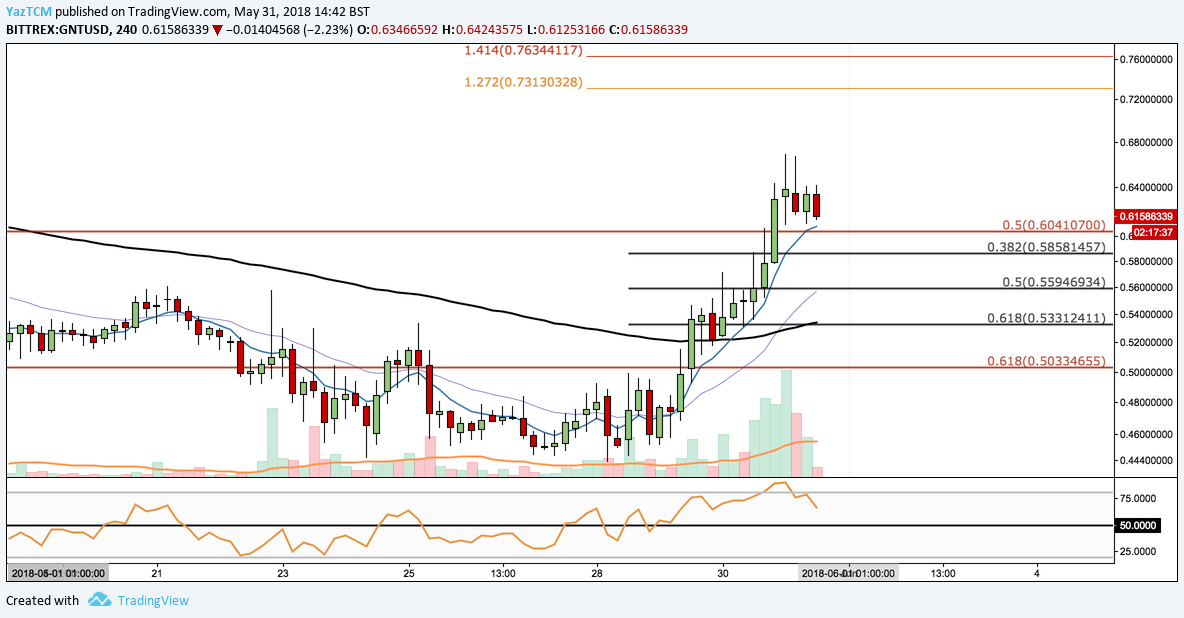
Price action looks promising for the bulls on the 4-hr charts. We can see that the market has battled it’s way above the .50 Fibonacci Retracement level and has began to level out around this handle.
We expect price action to slow, temporarily, due to the magnitude of the most recent bull run. We can already see that RSI, on the 4hr, has reached areas of overbought conditions and beginning to fall. However, after a short period, if price manages to break above the $0.67 handle, then we can expect price to continue with the bullish momentum and reach the 1.271-1.414 Fibonacci Extension at a price range of $0.73-0.76.
Alternatively, if price falls and hold below $0.60, we could expect price action to follow a small retracement, possibly within the region of the near-term .618 Fibonacci Retracement located at $0.53.
We will be closely monitoring any developments that come from the team in regards to the Golem mainnet. If the team can continue at their pace and delivery further use cases to purchase resources on Golem’s shared computer then the future is likely bright for GNT holders.
Follow the Development
In periods of uncertainty it is always useful to keep up-to-date with the latest development of a project. If the developers are remaining active within a project then you can be certain that they are remaining optimistic even if the markets are not projecting that optimism within price.
The following month should be a telling month for cryptocurrency prices. If prices manage to break major technical levels during the month of June then we may see a promising start for Q3 2018.