Download the Brave Browser.
The entire cryptocurrency market has had a bear pressure-filled week starting from “Bloody Sunday’”as the entire market cap of cryptocurrency dropped by over $50 billion, and BAT was no exception to the overall market.
BAT, at the time of writing, is down 11% over the past 24 hours and 27.69% over the past 30 days, as the token trades currently at $0.1972. To add further to this, the BAT token is down a total of over 50% since the past 30 days.
However, as markets are down across the entire board, this significant drop in value does not reflect the increased development that comes from the BAT team.
Basic Attention Token (BAT) is a crypto token that is designed to help change the online advertising industry by facilitating the flow of value between content creators, advertisers and viewers. It does this through its integration with the Brave browser.
The Brave browser is a competitor to internet browsing giants such as Firefox, Chrome and Internet Explorer. The Brave browser can boast about its decreased page loading time against its competitive browsers. The concept behind the Brave browser was to build a browser that kept privacy in mind. For this reason, the browser comes with in-built support tools for ad-blocking, cookie blocking and script-disabling software, eliminating the need to download 3rd party applications and creating a privacy-focused environment by default.
The founders of the browser and token have created a lot of excitement from investors due to their previous accolades. The browser and token were created by Brendan Eich and Brian Bondy. Brendan Eich was the creator of the JavaScript language and co-founder of the already successful web-browser Mozilla Firefox. Brian Bondy was previously a software engineer at Mozilla.
They created the browser and token with the aim to rethink the way that digital ads were delivered. Instead of the more traditional way of delivering ads, the Brave browser will display ads to users based off of the user’s attention. Advertisers will purchase advertising space within the Brave ecosystem using BAT tokens and users will only be displayed ads from a catalogue of adverts that they are interested in to begin with. Thus, this increases the efficiency of adverts that are delivered to a user and creates a new form of advertising exchange.
Along with helping to restructure advertising and decreasing page load times, the Brave browser will also save the user time and data charges from not loading adverts as users are charged, on average, $23 per month in data charges.
For a more detailed explanation on the benefits of using Brave or the BAT token, we recommend you read our “What is BAT” guide.
The BAT team has an exciting few months of development ahead of them with Ad Trials coming first, where partnered agencies and brands will be tested on the Brave browser. A new roadmap is expected sometime in June, but for a quick update check our recent articles on BAT’s roadmap and BAT’s recent developments.
Price Analysis
LONG TERM
BAT/USD – DAILY CHART – LONG TERM
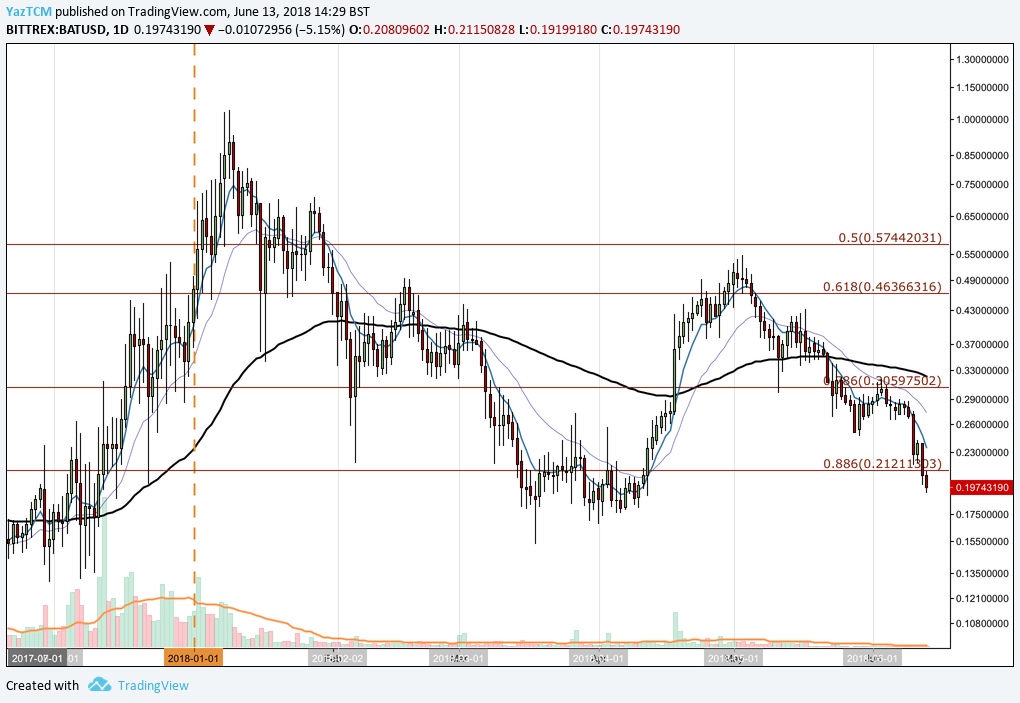
https://www.tradingview.com/x/a3zflPWw/
Looking at the chart from a long-term perspective, we can see that BAT has been having a tough year against the USD. BAT started trading the year at a price of $0.40 after experiencing an incredible bullish run during December 2017. Price action then went on to create an all time high at $1.04 during the first two weeks of January, before then going on to depreciate.
We can see that price action then went on to retrace just past the .886 Fibonacci Retracement at a price of $0.21 in March. This is a Fibonacci Retracement taken from the incredible bullish run seen in December 2017 all the way up to the high seen in mid-January 2018.
During April, price had a month of bullish action as price rose from a low of $0.16 to a high of $0.52, an incredible 200% price increase from low to high. However, as May came along prices began to roll over and have been trading in a bearish manner ever since.
Price action has recently, once again, broken below the .886 Fibonacci Retracement at $0.21 as it currently trades at $0.19. There is near term support, created from the lows in March and April, at a price range of $0.16 – $0.18. If prices can hold above this price range, it would be a good starting position to start a bullish run and regain some of the losses seen over the past 30 days.
We can also see that volume is considerably lower than the volume we had seen in the major bullish run during December. If we are to expect prices to make a long term recovery, then a significant increase in volume would need to be established.
Let us take a little closer look into price over the shorter term.
SHORT TERM
BAT/USD – DAILY CHART – SHORT TERM
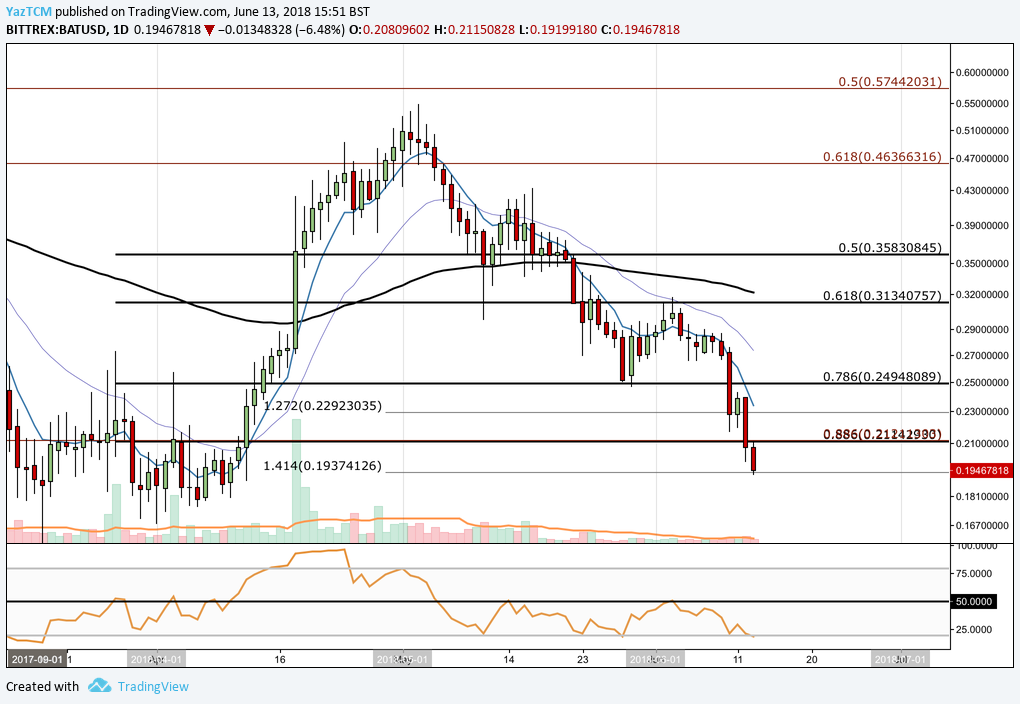
https://www.tradingview.com/x/0Ze7s12E/
Taking a deeper dive into more recent price action, we can see that price has recently found some support on the 1.414 Fibonacci Extension located at the $0.1937 price handle. This is a Fibonacci Extension of the initial bearish swing leg seen from June 3 up until the swing low seen on June 11. At this handle we could expect price action to find a brief period of support before the market decides what to do next.
We can also see that price action, along with breaking the long term .886 Fibonacci Retracement (noted above and marked in red), has also broken a short term .886 Fibonacci Retracement (marked in black) located in the exact same area. This confluence of indicators usually adds to the strength of the support or resistance within the area. In this scenario, price action will now hit strong resistance as it tries to make its way back above $0.21 and will require significant bullish momentum to overcome this price level.
If price action does manage to find some support at current levels and break above $0.21 then we could see the bullish momentum allow the market to make another attempt at the $0.25 handle. This is near term resistance and also the .786 short term Fibonacci Retracement.
Alternatively, if price action does mange to venture its way lower, there is near term support located within the $0.16 – $0.18 range with an absolute lowest possible support seen at $0.153 which is the low seen during March this year.
The technical indicators are largely favoring the bears on the daily chart. The RSI indicator is trading within extreme oversold conditions at it hovers around the 20 handle. A small ray of hope for the bulls come from the fact that the RSI does not stay in oversold territory for very long and a small bounce is experienced when the RSI hits 20 as evidenced by the recent times RSI has traded in similar territory.
The 7-day EMA and 21-day EMA are also largely favoring the bears as they have crossed under one another and have pulled away from each other by a substantial amount. For the bears to begin to garner some momentum for a bullish run, we would need to see the 7-day EMA stabilise and start to head toward the 21-day EMA. The convergence of the moving averages will indicate that the bears are beginning to fade and that the bulls may have an opportunity to step in.
Conclusion
With such a steep overall market drop over the past week, it is difficult to make trading decisions based from a fundamental trading stance. Although the markets may be down, the development for projects does not stop.
This rings true for BAT as the Brave team still have a long and exciting road of development ahead of them. As a trader it will be important to keep up to date with the latest updates to be sure not to miss a market driving update.
Related: Brave Software to Give Away $500,000 in BAT Every Month
Download the Brave Browser.