
- Support moving forward – $45.56, $43.85, $43.12, $41.82, $40.86, $40, $38.
- Resistance moving forward – $46.92, $49.59, $52.25, $55.56, $58.22, $60.
Monero has seen a small price increase totaling 1.14% over the past 24 hours of trading, bringing the current trading price up to around $46.96. The privacy-focused cryptocurrency has now seen a 7.52% price decline over the past 7 trading days but is still up by a small 4.33% over the past 40 trading days.
Monero is now ranked in 14th position with a total market cap value of $763 million. The cryptocurrency has dropped by 56% over the past 90 trading days. Now, the 56-month old project is trading at a value that is 90% lower than the all-time high price.
XMR/USD Price Analysis
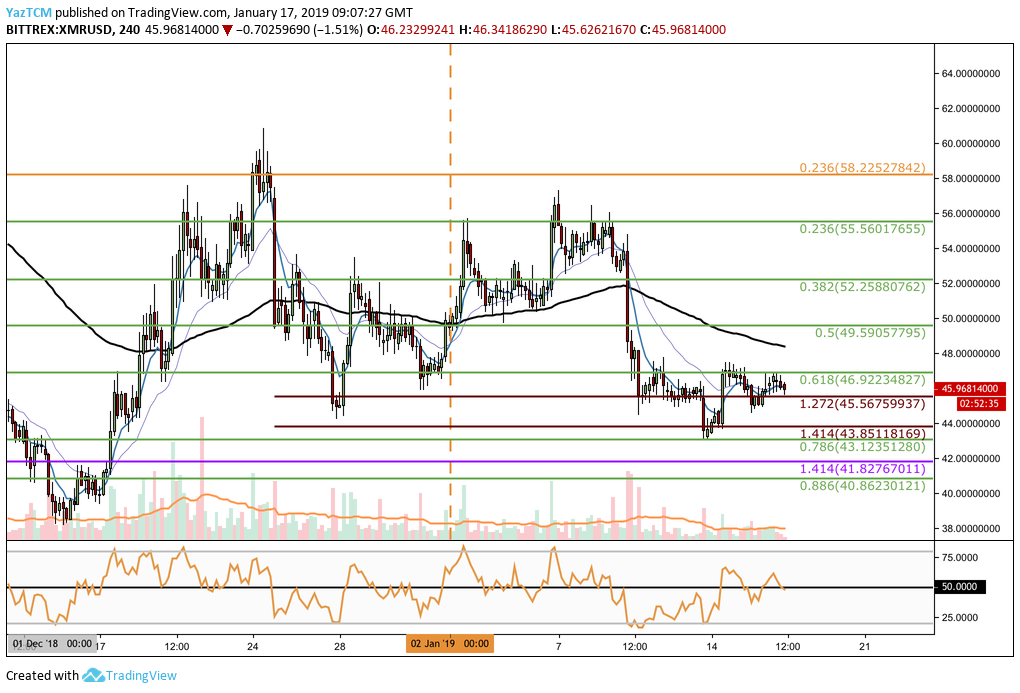
Analyzing price action from the 4-hour chart above, we can see that over the past trading week, price action had fallen from a high above $54 on January 10, 2019 and continued to fall until it reached support at the short-term .786 Fibonacci Retracement level (drawn in green) priced at $43.12.
After reaching this area of support at $43.12, the market proceeded to bounce but went on to meet resistance at the short-term .618 Fibonacci Retracement level (drawn in green) priced at $46.92.
XMR/USD was unable to overcome this level of resistance and now trades at support provided by a medium-term downside 1.272 Fibonacci Extension level (drawn in red) priced at $45.56.
Trend: Neutral
The XMR/USD market is now currently trading within a narrow trading range between $46.92 and $43.12, rendering a neutral trading condition as the market shifts sideways.
For this market to be considered bullish, we would need to see price action break above the trading range in the short term. Likewise, for a bearish market, price action would need to break below the trading range.
Where is the Support for XMR/USD Beneath the Market?
If the sellers continue to drive price action below the current support at $45.67, we can expect immediate support below to be located at the medium-term downside 1.414 Fibonacci Extension level (drawn in red) priced at $43.85. This is closely followed by support at the bottom of the trading range at the short-term .786 Fibonacci Retracement level (drawn in green) priced at $43.12.
If the bears continue to force price action below the trading range, more support is located at the short-term .886 Fibonacci Retracement level (drawn in green) priced at $40.86, followed by support at the December 2018 low priced around $38.20.
Where is the Resistance Above the Current Trading Range?
If the bulls can cause XMR/USD to break above the upper boundary of the trading range at $46.92, we can expect immediate resistance at the short-term .5 Fibonacci Retracement level (drawn in green) priced at $49.59.
If the buyers can then continue higher above the $50 handle, we can expect more resistance located at the short-term .382 and .236 Fibonacci Retracement levels (drawn in green), priced at $52.25 and $55.56 respectively.
Even more support above this level can then be located at the long-term bearish .236 Fibonacci Retracement level (drawn in orange) priced at $58.22, closely followed by resistance at $60.00.
This aforementioned bearish Fibonacci Retracement level is measured from the high seen in November 2018 to the low seen in December 2018.
XMR/BTC Analysis
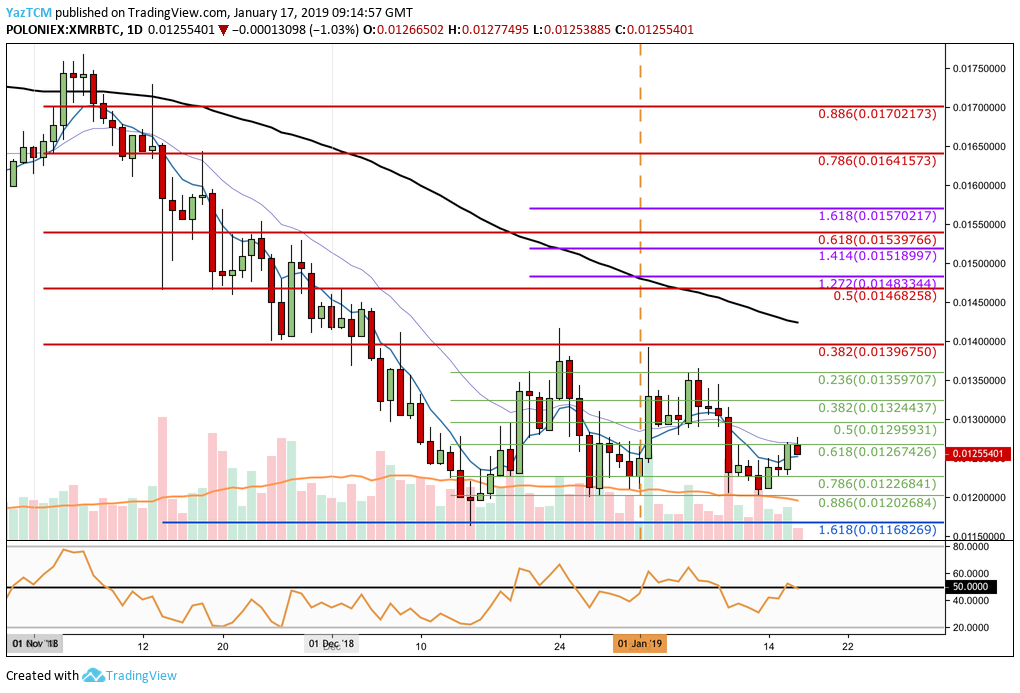
Taking a look at the daily XMR/BTC chart above, we can see that during November 2018 to December 2018 the market had dropped a considerable 34% from high to low.
The market decline stopped when price action approached a medium-term downside 1.618 Fibonacci Extension level (drawn in blue) priced at 0.01168 SATS.
After reaching this level of support, the market proceeded to rebound but was unable to climb above the bearish .382 Fibonacci Retracement level (drawn in red) priced at 0.01396 SATS. This bearish Fibonacci Retracement is measured from the high seen in November 2018 to the low seen in December 2018.
Price action then went on to fall but found support at the short-term .886 Fibonacci Retracement level (drawn in green) priced at 0.01202 SATS.
Since the market had entered 2019, price action has oscillated between the short-term .236 Fibonacci Retracement level (drawn in green) priced at 0.01359 SATS and the support at 0.01202 SATS.
Trend: Neutral
The market is currently trading within the retracement of the last swing leg higher. If price action breaks below 0.01202 SATS, we can consider the market bearish; and if it breaks above 0.01359 SATS, we can consider the market bullish in the short term.
Where is the Support for XMR/BTC Below the Current Market Price?
If the sellers continue to drive price action for XMR/BTC lower, expect immediate support at the short-term .786 and .886 Fibonacci Retracement levels (drawn in green) priced at 0.01226 SATS and 0.01202 SATS, respectively.
If price action continues to drop even lower, then more support can be located at the previous medium-term downside 1.618 Fibonacci Extension level (drawn in blue) priced at 0.01168 SATS.
Where is the Resistance Above the Market?
Towards the upside, the market will meet resistance at the short-term .618 and .5 Fibonacci Retracement levels (drawn in green) priced at 0.01267 SATS and 0.01259 SATS, respectively.
Further resistance above this can be expected at the short-term .236 Fibonacci Retracement level (drawn in green) priced at 0.01359 SATS. There is more resistance at the bearish .382 FIbonacci Retracement level (drawn in red) priced at 0.01396 SATS.
Higher resistance can be located at the bearish .5 and .618 Fibonacci Retracement levels (drawn in red) priced at 0.01468 SATS and 0.01539 SATS, respectively.
Conclusion
XMR/USD is currently trading in a consolidation phase.
For the market to turn bullish, we will need to see price action break above the $47 handle. However, if the market breaks below $43, we could see price action heading even further lower toward $40.