Litecoin has seen a strong price bounce over the past 24 hours of trading, totaling over 7.5, making it the strongest-performing cryptocurrency in the top 20 projects over the period. The recent price surge has now allowed Litecoin to break back above the $120 level, where it is currently trading today at around $125.
Litecoin has seen a 47% price surge over the past 30 days of trading, with a further 120% price explosion over the past 90 trading days.
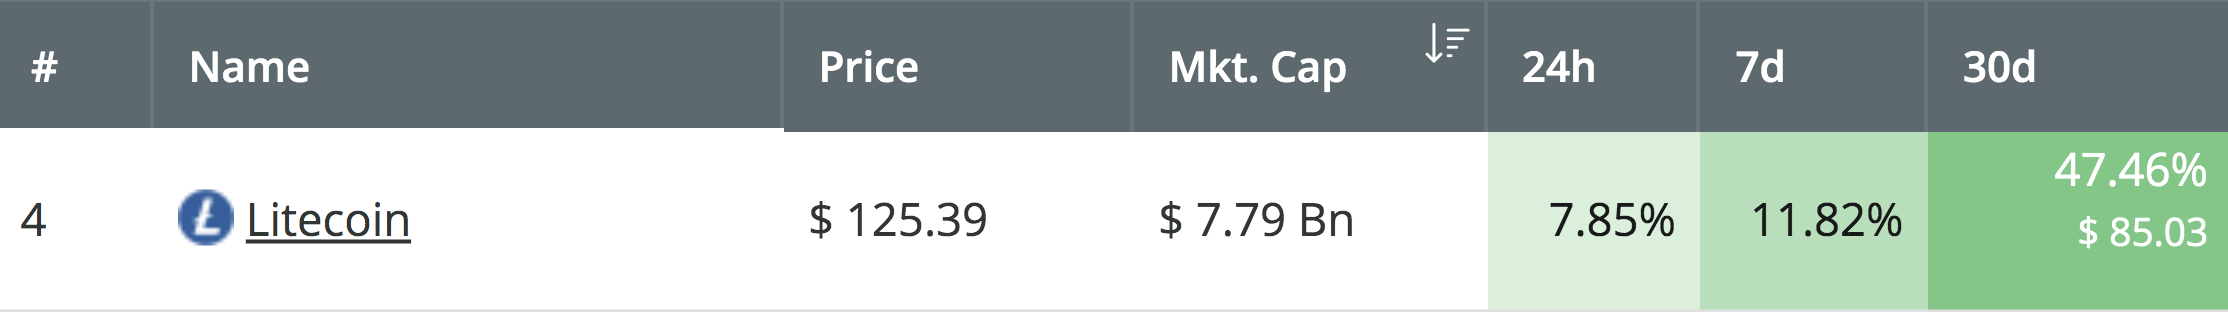
Source: CoinCheckup
The cryptocurrency is currently ranked in the 4th position on the cryptocurrency market cap rankings by market cap, as it currently holds a $7.79 billion market cap valuation. Litecoin has also recently managed to create a fresh 2019 high after breaking above the $120 resistance level.
Let us take a look at the LTC/USD market moving forward and highlight some potential areas of support and resistance moving forward.
Litecoin Price Analysis
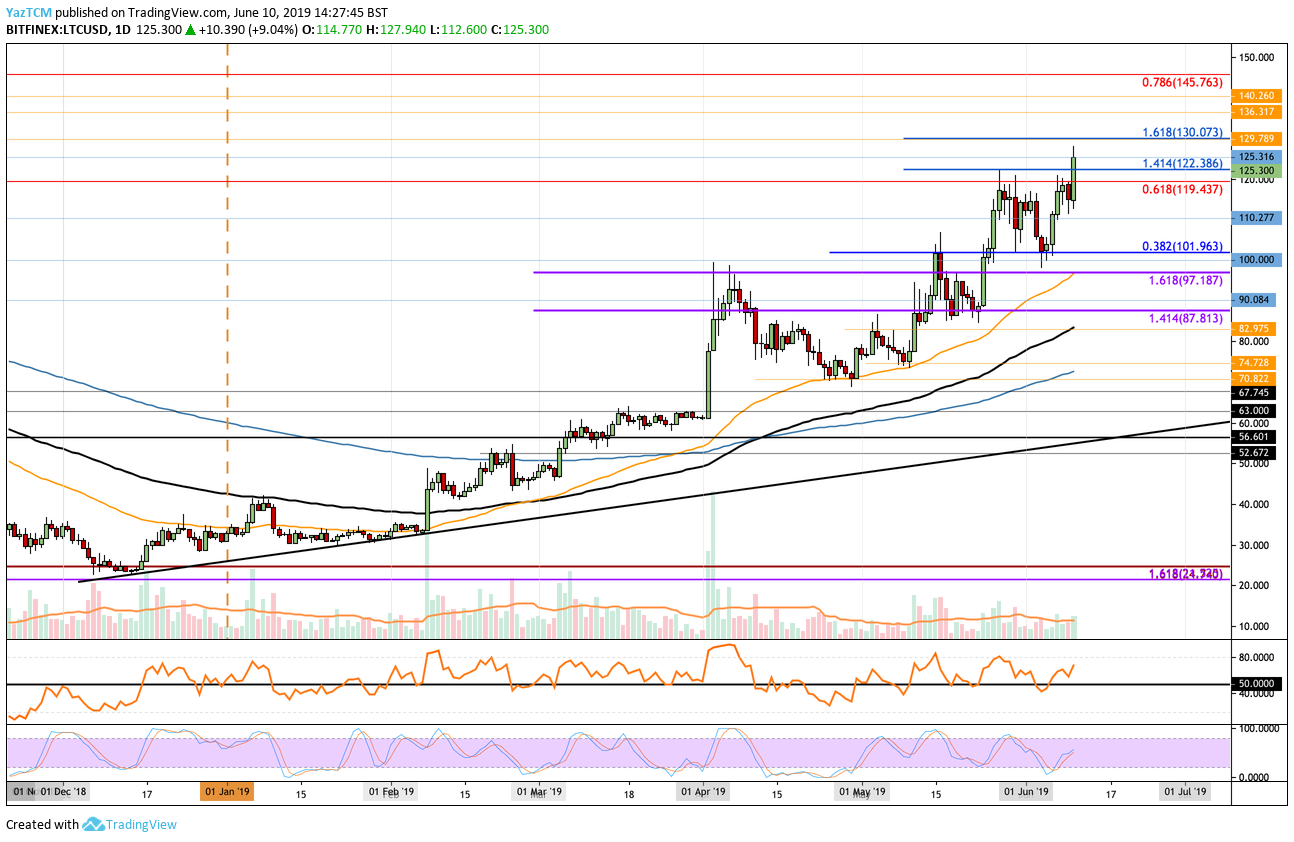
LTC/USD – MEDIUM TERM – DAILY CHART
What Has Been Going On?
Taking a look at the LTC/USD daily chart above, we can see that toward the end of May 2019, Litecoin had reached the resistance at a long-term bearish .618 Fibonacci Retracement level (drawn in red), priced at $119, measured from the May 2018 high to the December 2018 low. The market was unable to overcome this resistance and proceeded to fall as June 2019 started to trade.
Litecoin then went on to fall into support at the short-term .382 Fibonacci Retracement level (drawn in blue), priced at $101, before bouncing higher to break above the $119 resistance to reach the $125 level.
What Is the Current Trend?
The current trend for Litecoin remains bullish. For this bullish trend to be invalidated, we would need to see LTC/USD fall beneath the $100 support level.
Where Can We Go From Here?
If the buying pressure continues to causee LTC/USD to rise, we can expect immediate higher resistance above the market to be located at the short-term 1.618 Fibonacci Extension level (drawn in blue), priced at $130. Above this, further higher resistance is then expected at the $136 and $140 levels.
If the buyers continue above $140, further higher resistance is then located at the long-term bearish .786 Fibonacci Retracement level (drawn in red), priced at $145.76.
What Are the Technical Indicators Showing?
The Stochastic RSI recently delivered a bullish crossover signal in oversold territory, which then led to the rebound from $100 and break above the $119 resistance level. The RSI itself has also now climbed above the 50 level to indicate that the buyers are in control of the market momentum.
If the RSI can continue to rise higher, we can expect LTC/USD to continue to create fresh 2019 highs for LTC.