
Litecoin has seen a major price increase totaling 32% over the past 7 trading days, allowing the price for the cryptocurrency to climb toward the $115 level.
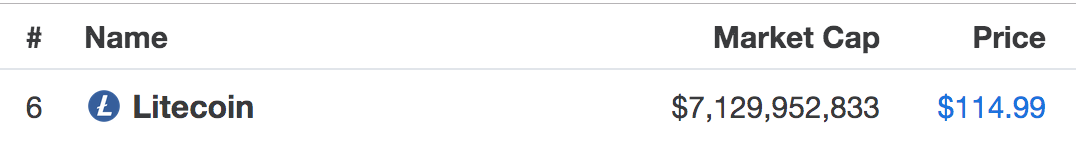
Source: CoinMarketCap
The cryptocurrency has now seen a 60% price surge over the past 30 days, with a further, rather explosive, 151% price increase over the past 90 days.
The price surge has continued after one of the hosts on CNBC’s Fast Money Segment had screamed to the audience to buy Litecoin. The host of the show preceded this investment advice by urging his audience to, “sell the house, sell the car, sell the kids.” Obviously, the host was not being literal but it seems that the little help from this segment has helped Litecoin continue its run higher.
Litecoin is now presently ranked in 6th position, after being overtaken by EOS, as it currently holds a $7.129 billion market cap valuation.
Let us continue to take a look at the LTC/USD market and highlight some potential areas of support and resistance moving forward
Litecoin Price Analysis
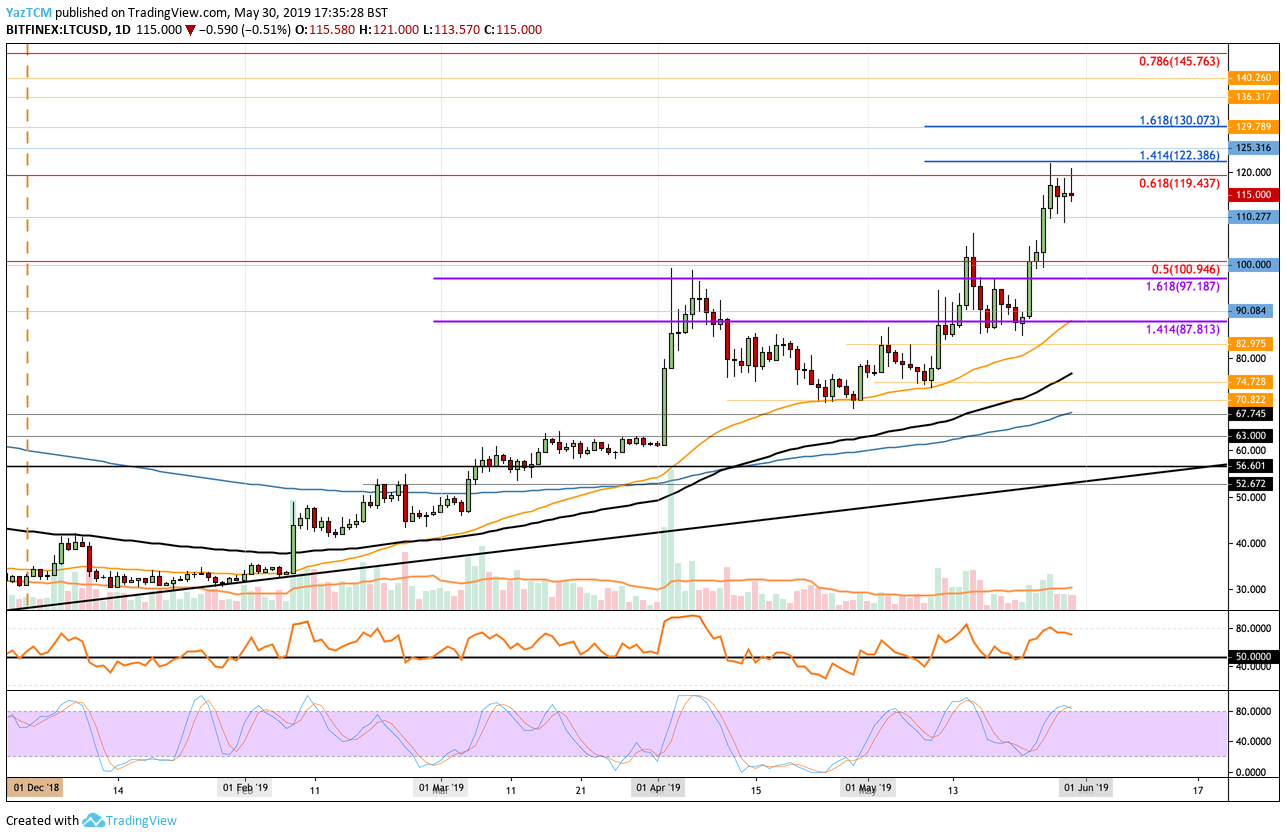
LTC/USD – DAILY CHART – MEDIUM TERM
What Has Been Going On?
Analyzing the 4hr LTC/USD chart above, we can see that Litecoin surged toward the second half of May 2019, to climb higher and create a fresh 2019 high at the resistance provided by the bearish .618 Fibonacci Retracement level (drawn in red), priced at $119.43. This bearish Fibonacci Retracement level is measured from the May 2018 high to the December 2018 low.
We can see that over the past week or so, Litecoin has struggled to break above this level of resistance.
What Is the Current Trend?
The current trend is still bullish. For this bullish trend to be invalidated, we would need to see LTC drop beneath the $87 level, at which point it would turn bearish.
Where Is the Resistance Above the Market?
If the buyers can continue to climb above the resistance at $119.43 and breach the $120 level, further higher resistance above is then expected at the short-term 1.414 and 1.618 FIbonacci Extension levels (drawn in blue), priced at $122.38 and $130.07.
Above $130, further higher resistance is expected at $136 and $140.
What If the Sellers Resume Control?
Alternatively, if the sellers regain control and push the market lower, we can expect support at $110, $100, $97.18, and $87.81.
What Are the Technical Indicators Showing?
The Stochastic RSI is warning traders to be wary as it currently trades in overbought conditions and is primed for a bearish crossover signal. If this is the case, we can expect a small retracement before price action breaks above the $120 level.
Conclusion
Litecoin has seen a majestic 151% price increase over the past 90 days allowing it to climb toward the $120 level. However, it seems that the market is struggling to break above this level of resistance and the indicators suggest a small pullback may be imminent so the bulls can catch their breath.