
IOTA has seen a small price bounce totaling 3.35% over the past 24 hours of trading, bringing the current price for the coin up to around $0.4332. The cryptocurrency had seen a precipitous price decline over the past 7 trading days – amounting to a drop of around -8.5% – after Bitcoin went through a rollercoaster of price swings.
However, after bouncing from the support at the 200-day EMA, it seems that IOTA is still on the bullish footing as it continues to show buy signals.
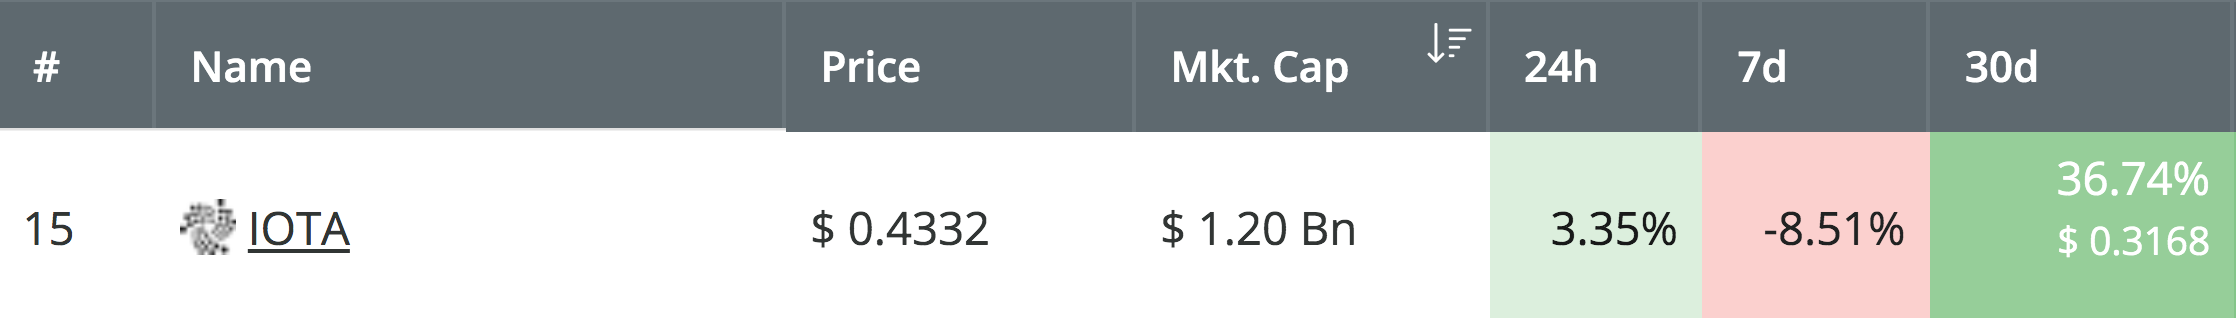
Source: CoinCheckup
IOTA is now presently ranked in 15th place amongst the top cryptocurrency projects by market cap value, as it presently holds a $1.20 billion market cap value. Despite the recent price declines, IOTA is still up by a total of 36% over the past 30 days, with a further 52% price surge over the past 3 months.
Let us take a look at the IOTA/USD market and analyze where we may potentially head toward moving forward.
IOTA Price Analysis
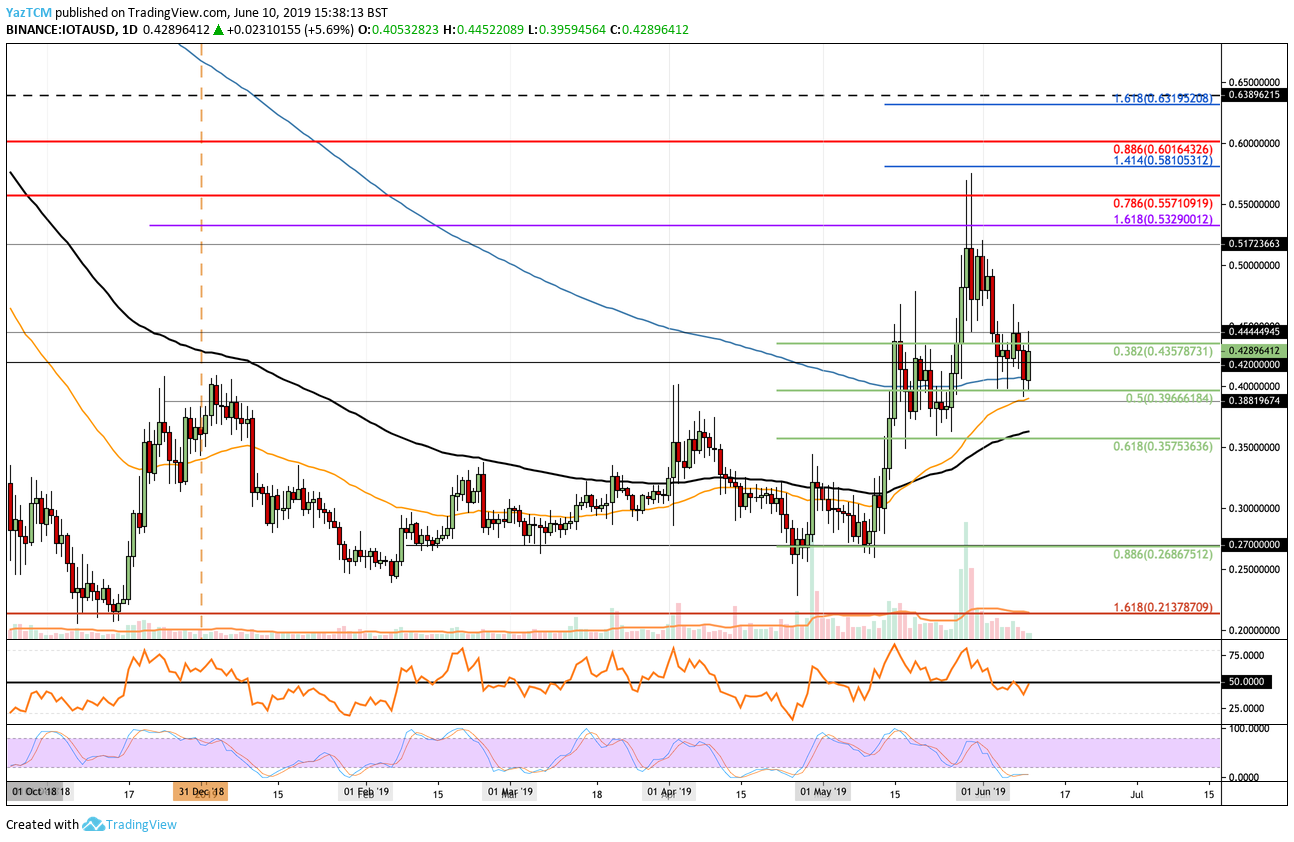
IOTA/USD – MEDIUM TERM – DAILY CHART
What Has Been Going On?
Analyzing price action for IOTA/USD on the daily chart above, we can see that the cryptocurrency rolled over toward the end of May 2019 after reaching resistance around $0.55. The cryptocurrency then went on to fall during the first week of Jun 2019, until recently reaching support at the .5 Fibonacci Retracement level (drawn in green), priced at $0.3966. We can see that IOTA/USD rebounded from this area to where it currently trades at around $0.4290. The support in this area is further bolstered by the 200-day EMA, which currently hovers at the $0.40 level.
What Is the Current Trend?
After rebounding at the $0.40 level, IOTA remains in a bullish trend. For this bullish trend to be invalidated, we would need to see IOTA fall and drop beneath the $0.40 level.
Where Can We Go From Here?
IOTA is currently testing the resistance around the $0.43 level. If it can break above there, the next level of resistance is then expected at the $0.47 and $0.50 levels. Above $0.50, further higher resistance is then to be expected at $0.5172 and then at the medium term 1.618 Fibonacci Extension level (drawn in purple) priced at $0.5329.
Above $0.54, further higher resistance is then to be located at the bearish .786 and .886 Fibonacci Retracement levels (drawn in red) priced at $0.5571 and $0.6016, respectively.
What Are the Technical Indicators Showing?
The RSI has recently reapproached the 50 level, indicating indecision within the market. We will need to see the RSI break above the 50 level if we would like to see IOTA travel higher. Furthermore, the Stochastic RSI is also in oversold conditions as we wait for a bullish crossover signal to push the market higher.