
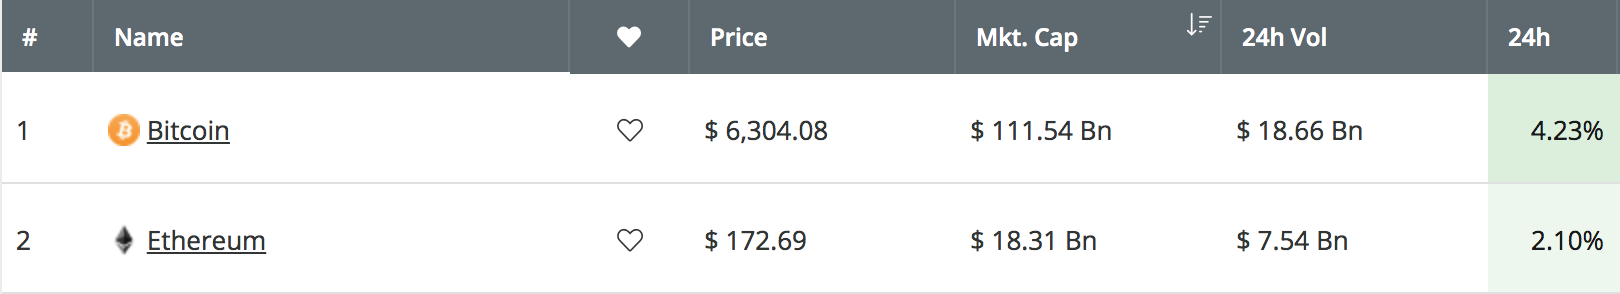
Ethereum has seen a rather sluggish 30-day period of trading after the cryptocurrency only managed to move by a total of -2.6% over the stated period. However, over the past 24 hours, the cryptocurrency has risen by a total of 1.75%, bringing its current trading price up to around $174.50.
Ethereum remains ranked in 2nd position, as the cryptocurrency currently holds an $18.31 billion market cap valuation.
Despite Bitcoin’s enormous 81% price growth over the past 90 trading days, Ethereum has only managed to climb a total of 40% in the same period. This is largely due to the fact that Ethereum has been consistently falling against Bitcoin all year round.
ETH/BTC started the year at a high above 0.041 BTC and has fallen by a total of 34% to its current trading price at around 0.0273 BTC. If we would like to see some gains for Ethereum that are similar to those of Bitcoin, we would need ETH/BTC to reverse and start to climb once again.
Regardless of the recent price drops against Bitcoin, Ethereum has still managed to remain relatively stable around the $160-$180 price range. This is largely due to the rising prices of Bitcoin counteracting the falling prices of ETH/BTC.
In this article, we will highlight some of the significant areas of resistance for Ethereum on the way up toward the $200 target level.
Ethereum Analysis
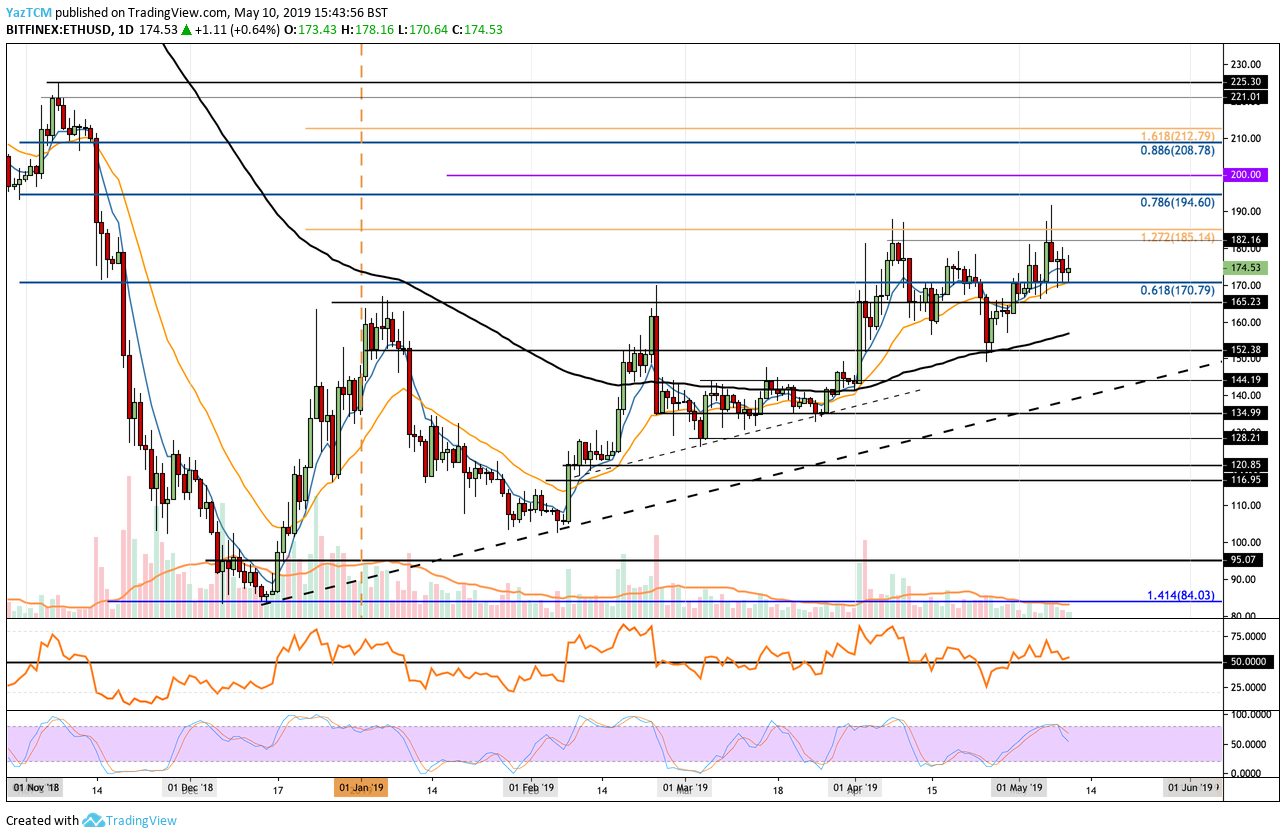
ETH/USD – MEDIUM TERM – DAILY CHART
What Has Been Going On?
Analysing the ETH/USD chart above on the daily time frame, we can see that Ethereum managed to break above the 100-day moving average level (thick black line) toward the start of April 2019. After breaking above, the cryptocurrency went on to rise higher, but was unable to overcome the resistance at the $185 level. The resistance at $185 is provided by a 1.272 Fibonacci Extension level (drawn in orange).
After hitting this level of resistance, ETH/USD went on to roll over and fall into support back at the 100-day moving average level toward the end of April 2019.
The market has recently managed to re-test the resistance at $185 during May 2019, but was unable to break above. Price action is now currently trading around the $174 level.
What Is the Current Short-Term Trend?
The current short-term trend for ETH/USD is presently neutral. For this market to turn bullish, we would need to see price action rise and break above the $185 resistance level. If Ethereum was to fall below the $150 level, we could then consider the market as turning bearish.
Where Can We Go From Here?
If the bulls continue with their recent momentum and start to drive ETH/USD higher, we can expect immediate resistance above the market to be located at the $180 level followed by more resistance at the $185 level.
If the bullish pressure causes Ethereum to climb above the $185 resistance level, we can then expect higher resistance above to be located at the bearish .786 Fibonacci Retracement level (drawn in blue), priced at $194.60. This bearish Fibonacci Retracement level is measured from the November 2018 high to the December 2018 low.
If the buyers can then continue to break above the resistance at $194.60, they will be clear to make an attempt at the $200 target level for Ethereum.
If ETH/USD continues further higher above the $200 level, resistance above $200 can then be expected at the bearish .886 Fibonacci Retracement level (drawn in blue), priced at $208.78.
What If the Sellers Resume Control?
Alternatively, if the sellers group back up and start to push the price lower for ETH/USD, we can expect immediate support beneath the market to be located at $170. This level of support contains the .618 Fibonacci Retracement level (drawn in blue).
Beneath $170, further support then lies at $165 and $160. The support around $160 is further bolstered by the 100-day moving average which hovers around this price region. If the sellers continue beneath $160, more support is located at $155 and $150.
What Are the Technical Indicators Showing?
The RSI is trading along the 50 level which indicates that there is indecision within the market between the bulls and the bears. If we would like to see ETH/USD break above the resistance at $185, we need to see the RSI climb away from the 50 level to indicate that the bullish momentum is increasing.
Conclusion
Ethereum can certainly reach the $200 resistance level pretty soon. However, the bulls will need to contest resistance at $185 and $194 before being clear to make an attempt at $200. If we would like to see this come to fruition, we would need to see the ETH/BTC market stop falling and reverse.