
The Ethereum price surge continues above $200 after a further 10.28% price increase over the past 24 hours, bringing the current price for the coin up to around $232. Ethereum has recently managed to reverse against Bitcoin, which in turn has helped Ethereum see a massive 35% price increase over the past 7 trading days.

Ethereum remains ranked in the second position in the market cap rankings, as it presently holds a $24.34 billion market cap valuation. The cryptocurrency has now seen a rather magnificent price explosion of 93% over the past 90 trading days.
In fact, if the bullish pressure continues further higher, there is not much resistance on the way up toward the target level of $150 for Ethereum. Let us take a look at the ETH/USD market and highlight some potential areas of support and resistance on the way up toward $150.
Ethereum Price Analysis
ETH/USD – MEDIUM TERM – DAILY CHART
What Has Been Going On?
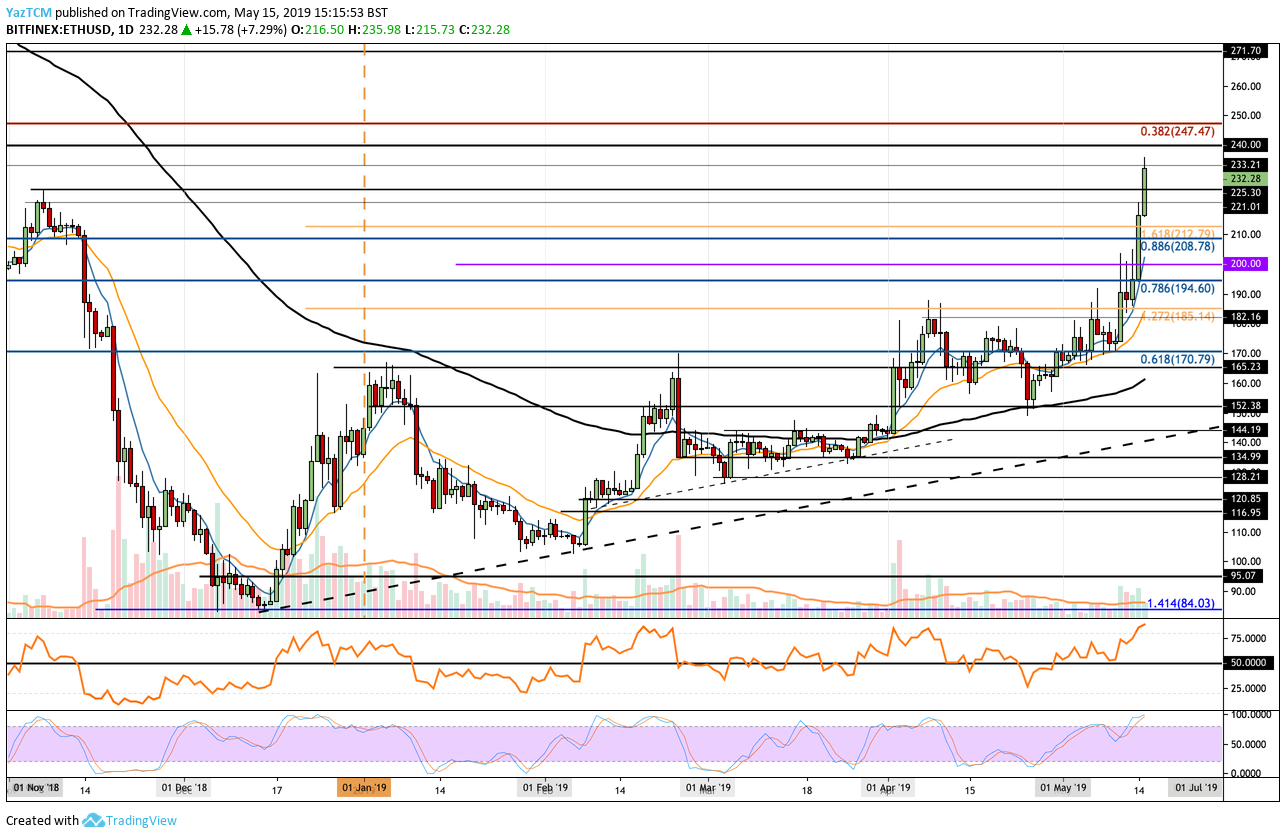
Taking a look at the ETH/USD daily chart above, we can see that the market has surged past the $200 and continued further higher over the past 2 days of trading. The cryptocurrency has now placed a fresh 2019 as well as a 6-month high in the process.
ETH/USD is now currently trading at resistance provided at the $233 level, which also provided strong resistance for the market during October 2019.
What Is the Current Short-Term Trend?
The current short-term trend for ETH/USD remains bullish after the 35% price increase over the past 7 trading days. For this bullish trend to become invalidated, we would need to see ETH/USD fall and break beneath the $200 support level. If ETH/USD was to fall back beneath the $185 support level, we could consider the market to be bearish.
Where Is the Resistance On the Way Up To $250?
If the buyers can continue to climb above the current resistance at the $233 level, we can expect immediate higher resistance above to be located at $240. Above $240, the next level of significant resistance for the buyers to overcome is located at the long-term bearish .382 Fibonacci Retracement level (drawn in red), priced at $247. This bearish Fibonacci Retracement level is measured from the July 2018 high to the December 2018 low.
If the bulls can clear the $247 level, they will be clear to make an attempt at the $250 target level. Above $150, more resistance lies at $255, $260, and $270.
What If the Sellers Regroup?
Alternatively, if the sellers regroup and begin to push the market further lower, we can expect immediate support toward the downside to be located at $225, $221, and $212. Beneath this, further strong support then lies at the previous .886 Fibonacci Retracement level (drawn in blue), priced at $208 and then at the round $200 level.
Beneath $200, further support is then expected at $184 and then at the previous strong resistance level (now strong support) of $185.
What Are the Technical Indicators Showing?
The technical indicators are warning traders now to be wary. The RSI is now trading within an extremely overbought territory, which indicates that the bulls may be running out of steam at some point in the near future.
Furthermore, the Stochastic RSI is also poised for a bearish crossover in overbought territory, which is a bearish sign within the market.
Conclusion
The recent price surge for Ethereum has largely been fueled by the recent Bitcoin price rise and the recent ETH/BTC turnaround. However, there are signs that the bulls may be slightly overstretched, which could result in a small pullback over the next few days.
Regardless of this, if the bullish presence continues further higher, the Ethereum market is positioned to make an attempt at the $150 level after it manages to clear strong resistance at $147.