
- Ethereum scaling solutions are on the horizon with the Constantinople hard fork and the activation of the Raiden Network.
- Ethereum now needs to break above significant resistance at $155 to head higher.
- Support moving forward: $138.29, $127.85, $119.39, $110.94, $100, $98.91, $91.74, $84.03.
- Resistance moving forward: $150, $155.12, $171.94, $180.57, $190.83, $197.73, $200, $205.55.
Latest Ethereum News
It is a fresh new year for Ethereum. 2018 was a rough year for the majority of the cryptocurrency industry and Ethereum was no exception as the market hit a low of $84 in December 2018.
However, the outlook is looking positive for the Ethereum network as the development team gears up for their long-awaited Constantinople hard fork.
The Constantinople upgrade will be one of the main driving components to help ease the transition from a PoW algorithm to a much more eco-friendly PoS algorithm.
The hard fork is set for block #7080000, slated for around January 16, 2018. To find out more about the Ethereum Improvement Protocols (EIPs) involved in the Constantinople, upgrade we recommend taking a look at this article.
In other scaling news, the off-chain scaling solution known as Raiden is now live on the Ethereum blockchain for alpha testing.
The Raiden Network, similar to the Lightning Network on Bitcoin, is an off-chain solution to help Ethereum scale to 1 million transactions per second, something which has been needed significantly for over a year now.
To further add to the excitement of the new year, Ethereum is now very close to reclaiming the number 2 spot in the market cap rankings.
Ripple overtook Ethereum in recent months but the Ethereum market has managed to claw back some of the losses. It now sits only $70 million behind Ripple in market cap, at the time of writing, as Ethereum currently holds a market cap value of $14.72 billion and Ripple holds $14.79 billion.
Let us continue to take a look at price action for Ethereum over the short term and highlight any possible support and resistance zones moving forward.
Ethereum Price Analysis
Ethereum has seen a positive price increase totaling 5% over the past 24 hours of trading as the market is currently exchanging around a price of $144.87, at the time of writing.
The decentralized operating system has now seen a 6.59% price rise over the past 7 trading days, making it the top performer within the top 10 over the stated period. Over the past 30 trading days, it experienced a 21% price surge.
Still sitting in 3rd position with a $14.72 billion market cap value, the Ethereum network has undergone a steep 37% price plummet over the previous 90-day trading period. The 41-month old coin now trades at a value that is 89% lower than the all-time high price.
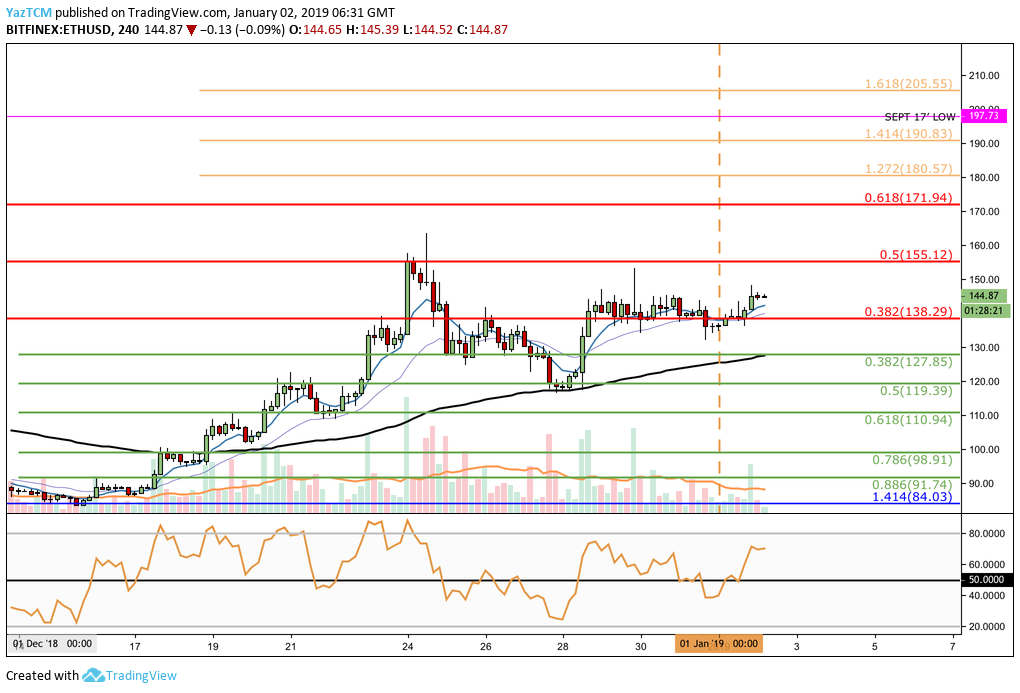
Analyzing price action for ETH/USD from the short-term perspective above, we can see that since our last article, Ethereum had dropped slightly toward our expected support level at the short-term .5 Fibonacci Retracement level (drawn in green) priced at $119.39.
After hitting this level of support, the ETH/USD market rebounded to break above the long-term bearish .382 Fibonacci Retracement level (drawn in red) priced at $138.29. The market has been trading along this level of support ever since.
Trend: Bullish Above $155
The short-term bullish trend is still in play as Ethereum refuses to make lower lows.
If the market can create a fresh high above the $155 handle, breaking above the December 2018 high, we could consider that ETH/USD is in the verge of reversing the long-term bearish trend into a bullish trend.
For the short-term trend to turn bearish, we would need to see Ethereum breaking below the support at $119.39.
Where is the Resistance for ETH Above the $150 Handle?
If the buyers can cause price action to climb above the resistance around the $150 handle, they will meet immediate further resistance at the bearish .5 Fibonacci Retracement level (drawn in red) priced at $155.12.
This Fibonacci Retracement is measured from the high seen during November 2018 to the low placed in December 2018.
Higher resistance above the $155 handle can then be expected at the bearish .618 Fibonacci Retracement level (drawn in red) priced at $171.94. This area of resistance will require significant momentum to overcome as this will be a major pivotal price point for the long-term bullish trend to be established.
If the bulls can continue higher, more resistance toward the upside can be located at the 1.272 and 1.414 Fibonacci Extension levels (drawn in orange), priced at $180.57 and $190.83 respectively.
Where is the Resistance for ETH Located Below the $138.29 Handle?
If the bears regroup within the market and begin to push price action below the recently established support at $138.29, immediate further support toward the downside can be located at the short-term .382 and .5 Fibonacci Retracement level (drawn in green), priced at $127.85 and $119.39.
If the sellers continue to drive price action further lower, we can then expect further support beneath to be located at the short-term .618 and .886 Fibonacci Retracement levels (drawn in green), priced at $110.94 and $91.74 respectively.
Conclusion
The scaling solutions for Ethereum have been long in the making. With solutions now on the visible horizon, it is likely that faith will restored in the Ethereum blockchain that has been plagued by slow transaction rates, slowing the pace for the development of dapps upon the network.
The time leading up to a hard fork can be a very volatile period within the market due to the uncertainty of the stability of the network during the hard fork period. If the bulls can cause price action to break above the $155 handle, we can expect the market to continue to rise.