
- Support moving forward: $4.28, $4.00, $3.85, $3.59, $3.38, $3.00.
- Resistance moving forward: $4.59, $4.89, $5.00, $5.90, $6.59, $6.94, $7.48, $8.61, $9.28, $10.00.
Latest Ethereum Classic News
Earlier in the month, Ethereum Classic was a victim of a 51% attack after Coinbase uncovered that 88,500 ETC were falsely deposited into the OKEx cryptocurrency exchange.
ETC Price Analysis
Ethereum Classic has seen a small price rise totaling 1.75% over the past 24 hours of trading. The cryptocurrency is now trading at a price of $4.40, at the time of writing, after suffering a small price decline totaling 2.57% over the past 7 trading days.
Ethereum Classic is now ranked in 18th position and currently holds a $471 million market cap value. The 30-month old project has now seen a price drop totaling 54% over the past 90 trading days.
ETC/USD Price
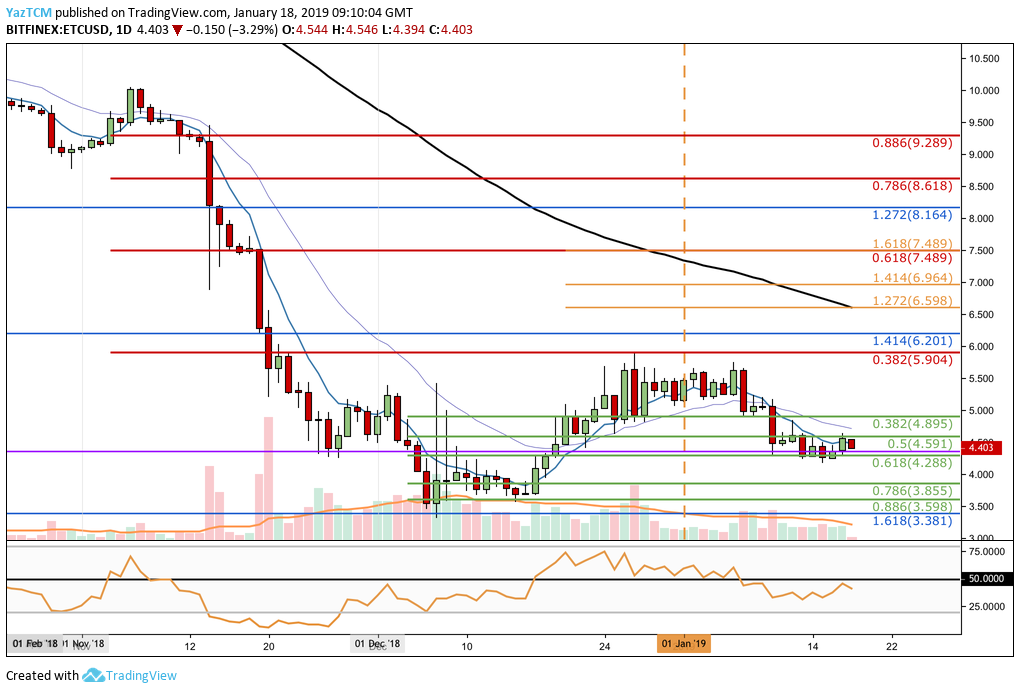
Analyzing the market for ETC/USD from the daily chart above, we can see that price action had slipped below our previously highlighted support zone at $4.35 (drawn in purple) and continued to decline until it reached further support below at a medium-term downside 1.618 Fibonacci Extension level (drawn in blue) priced at $3.38 towards the start of December 2018.
The market went on to rally during December 2018 but met resistance at the bearish .382 FIbonacci Retracement level (drawn in red) priced at $5.90. This Fibonacci Retracement is measured from the high in November 2018 to the low seen in December 2018.
Price action was unable to overcome this area of resistance and proceeded to roll over and fall. The market then went on to decline until it reached support at a short-term .618 Fibonacci Retracement level (drawn in green) priced at $4.28.
Trend: Neutral
The recent rebound at $4.28 has stalled the previous short-term downtrend. However, if the market does head below $4.28 again, we can consider the market to have returned to a bearish trading condition.
For this market to be considered bullish, we would need to see price action break above the $6.00 handle.
Where is the Support Below $4.28?
If the sellers to manage to push ETC/USD below the $4.28 handle and continue below the $4.00 handle, we can expect further support below at the short-term .786 and .886 Fibonacci Retracement levels (drawn in green) priced at $3.85 and $3.59, respectively.
If the market then heads further lower, more support is located at the previous downside 1.618 Fibonacci Extension level (drawn in blue) priced at $3.38.
Where is the Resistance Towards the Upside?
Alternatively, if the bulls can manage to regroup and begin to push price action higher, we can expect initial resistance higher to be located at the short-term .5 and .382 Fibonacci Retracement levels (drawn in green), priced at $4.59 and $4.89 respectively.
If they can continue to climb above the $5.00 handle, further resistance is located at the bearish .382 Fibonacci Retracement level (drawn in red) priced at $5.90.
Providing the bullish pressure causes ETC/USD to break above the $6.00 handle, we can expect resistance above to be located at the short-term 1.272 and 1.414 Fibonacci Extension levels (drawn in orange) priced at $6.59 and $6.94, respectively.
Resistance above this can be found at the bearish .618 FIbonacci Retracement level (drawn in red) priced at $7.48. This area of resistance is also further bolstered by the short-term 1.618 Fibonacci Extension level (drawn in orange) priced in the same area.
ETC/BTC Price
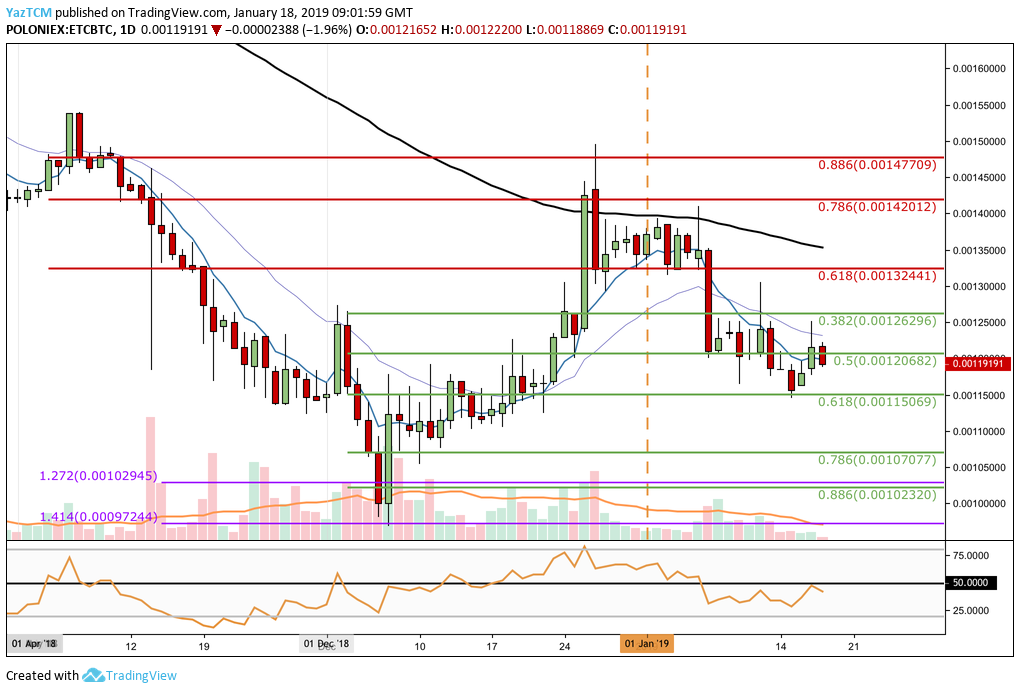
Taking a look at the daily chart above for ETC/BTC, we can see that the market declined in November 2018 and continued to fall until support was met a medium-term downside 1.414 Fibonacci Extension level (drawn in purple) priced at 97,244 SATS during the early stage of December 2018.
After reaching this level of support, the market went on to rebound and began to travel higher. However, towards the end of December 2018, ETC/BTC met resistance at the bearish .786 Fibonacci Retracement level (drawn in red) priced at 142,012 SATS.
Price action was unable to overcome this area.
As trading began in 2019, the market declined until support was met at the short-term .618 Fibonacci Retracement level (drawn in green) priced at 115,069 SATS.
Trend: Neutral
Currently, the trend is a neutral trading condition although it is on the brink of turning bearish. If price action breaks below 115,000 SATS handle, we can consider the market to be bearish again in the short term.
Where is the Support Below the Market?
If price action continues to fall, we can expect immediate support at the short-term .618 Fibonacci Retracement level (drawn in green) priced at 115,069 SATS.
If the sellers drive price action below the 110,000 SATS handle, more support below is located at the short-term .786 and .886 Fibonacci Retracement levels (drawn in green), priced at 107,077 SATS and 102,320 SATS respectively.
If the bears continue to drive the market below the 100,000 SATS handle, there is more support at the previous downside 1.414 Fibonacci Extension level (drawn in purple) priced at 97,244 SATS.
Where is the Resistance Above the Market?
If the buyers regroup and begin to push price action higher, immediate resistance is located at the short-term .5 and .618 Fibonacci Retracement levels (drawn in green), priced at 120,682 SATS and 126,2996 SATS respectively.
Further resistance above this will then be expected at the bearish .618 Fibonacci Retracement level (drawn in red) priced at 132,441 SATS.
If the bulls break above the 140,000 SATS handle, we can expect higher resistance at the bearish .786 and .886 FIbonacci Retracement levels (drawn in red), priced at 142,012 SATS and 147,709 SATS respectively.