
Ethereum may have seen a sharp 7% price fall over the past 7 days of trading. However, the cryptocurrency has recently delivered some signals that suggest the fall is over, and it’s now time to buy the cryptocurrency.
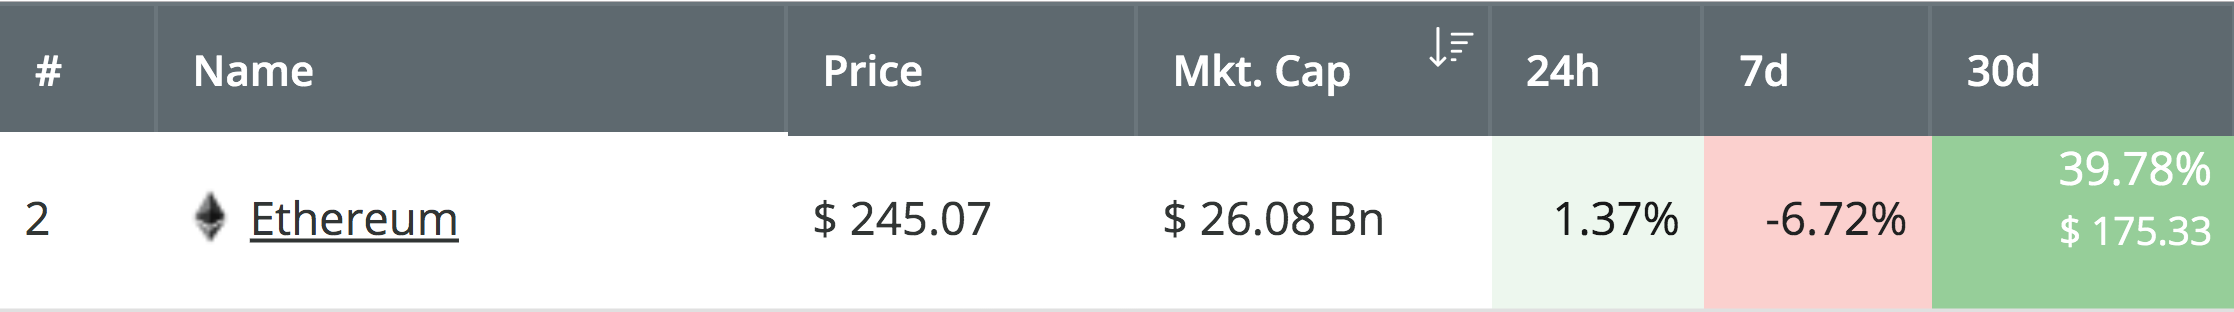
Ethereum experienced a price rebound over the past 24 hours of trading, which totals over 1.35%, allowing price action for the coin to rise back toward the $245 level. Even with the price falls of the past week, Ethereum is still up by a total of 40% over the past 30 days, with a further 83% price explosion over the past 3 months.
Source: CoinCheckup
Ethereum remains ranked in the second place amongst the top cryptocurrency projects by market cap value, as it currently holds a $26.08 billion market cap valuation.
There are some technical signals that have suggested it is time to buy the cryptocurrency. For example, the Stochastic RSI recently delivered a bullish crossover signal in oversold territory, and the 100-day EMA and recently just crossed up above the 200 day EMA which is a strong bullish signal.
Let us take a look at the ETH/USD market and highlight some potential areas of support and resistance moving forward.
Ethereum Price Analysis
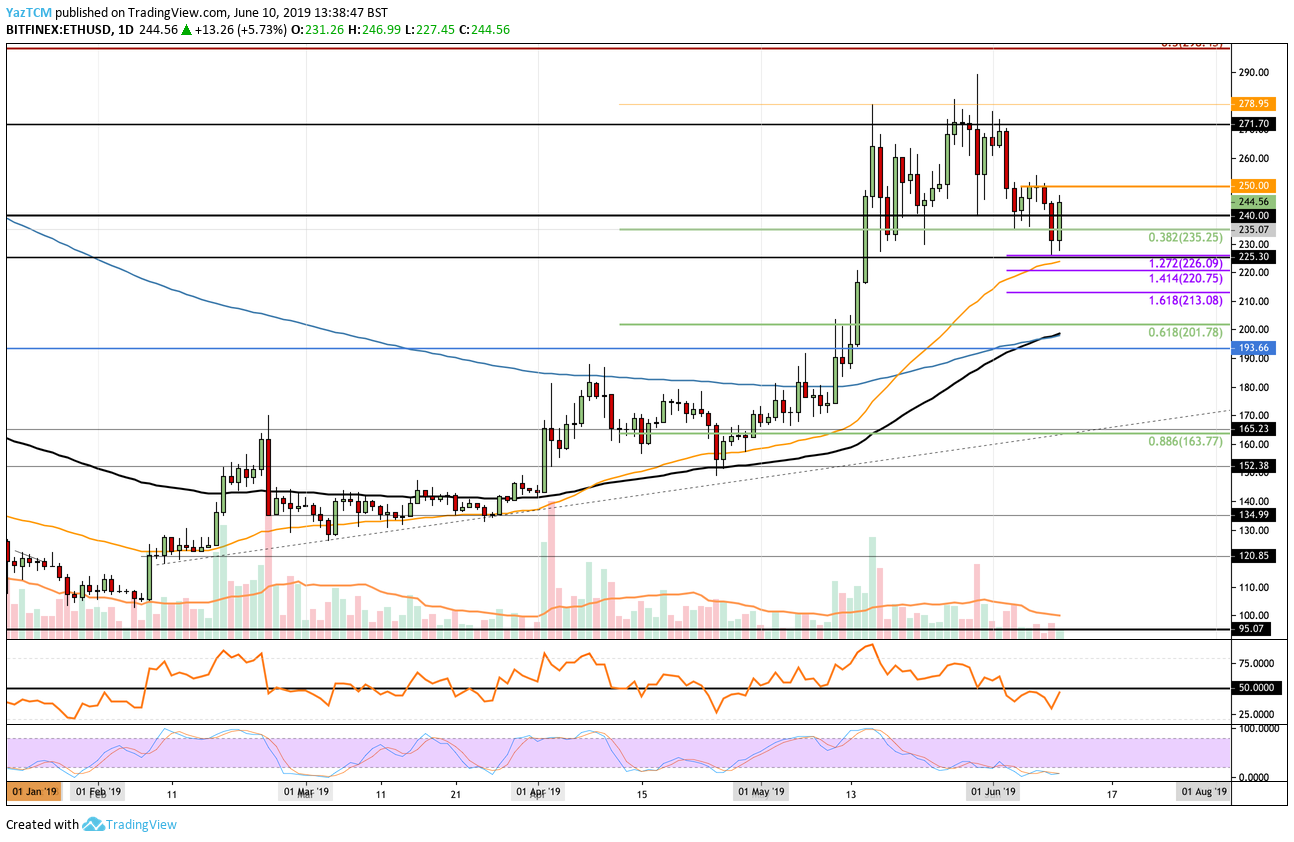
ETH/USD – MEDIUM TERM – DAILY CHART
What Has Been Going On?
We can see that after rolling over at the resistance at the $270 level toward the start of June 2019, Ethereum continued to fall further lower, dropping beneath the support at the short-term .382 Fibonacci Retracement level at $235. It met further support beneath at $226, provided by a short-term downside 1.272 FIbonacci Extension level (drawn in purple).
Price action has since rebounded from this support and is now trading higher around $245.
What Is the Current Trend?
The current trend for Ethereum is currently neutral in the short term. However, it still remains bullish in the long term. For the short term trend to turn bullish again, we would need to see ETH/USD climb and break above the $250 resistance level.
Where Is the Resistance Above the Market?
The first level of resistance for ETH/USD to contest is located at the $250 level. Above this, the next levels of resistance then lie at the $270 and $278 resistance levels. These areas had provided significant resistance for the market during May 2019, and are expected to provide significant resistance moving forward.
Above $280, further higher resistance then lies at the long-term bearish .5 Fibonacci Retracement level priced at $298.
What Are the Technical Indicators Showing?
The Stochastic RSI has recently produced a bullish crossover signal in oversold territory, which signals that the selling may be over. Adding further to this, the RSI itself has recently bounced back toward the 50 level as the bulls attempt to regain the market momentum.
Conclusion
Despite the sharp price declines over the past 7 trading days, Ethereum is still up by a very impressive 83% over the past 3 months of trading. The cryptocurrency rebounded around support at $226 and is now attempting to break higher above $250.
The Stochastic RSI indicator has recently produced a bullish signal, along with the 100-day EMA and 200-day EMA crossing over each other. These two bullish signals are both strong enough to suggest that its time to buy Ethereum again.