
At the start of April 2019 we had written an article about ScienceGuys’s prediction for Ethereum to reach $2090. The analyst had predicted a breakout of Ethereum by April 24, 2019, which would see the market to continue to climb higher toward the $2000 handle.
However it seems that the Etheruem breakout had occurred much faster than he had predicted as the market has managed to reach the $185 level in today’s trading session. Nevertheless, ScienceGuy9489 is back with a brand new Ethereum prediction. On Twitter, the analyst had predicted that Ethereum is in a breakout ‘attempt’ on its way up to $200 with the following tweet;
#Ethereum breakout attempt in progress, first resistance is 200 Day Moving Average which is currently $181. Breaking through that the new resistance is at $200. #ETH rising faster than #Bitcoin at the moment as expected. pic.twitter.com/Gc1feekfLg
— ScienceGuy9489 (@ScienceGuy9489) April 7, 2019
ScienceGuy9489 posted a similar chart to his previous prediction in which he states that the cryptocurrency is now approaching the 200 day moving average, around the $181 level, where initial resistance will be met.
He went on to state that if Ethereum can break above the 200 day moving average level then the market is clear to test the $200 level.
Since he had posted the tweet the market has made an attempt to break above the 200 day moving average but had failed to remain above thus far.
Let us take a look at the Etheruem market and highlight the areas of resistance on the way to and above the $200 level.
Etheruem Price Analysis
ETH/USD – SHORT TERM – DAILY CHART
What Has Been Going On?
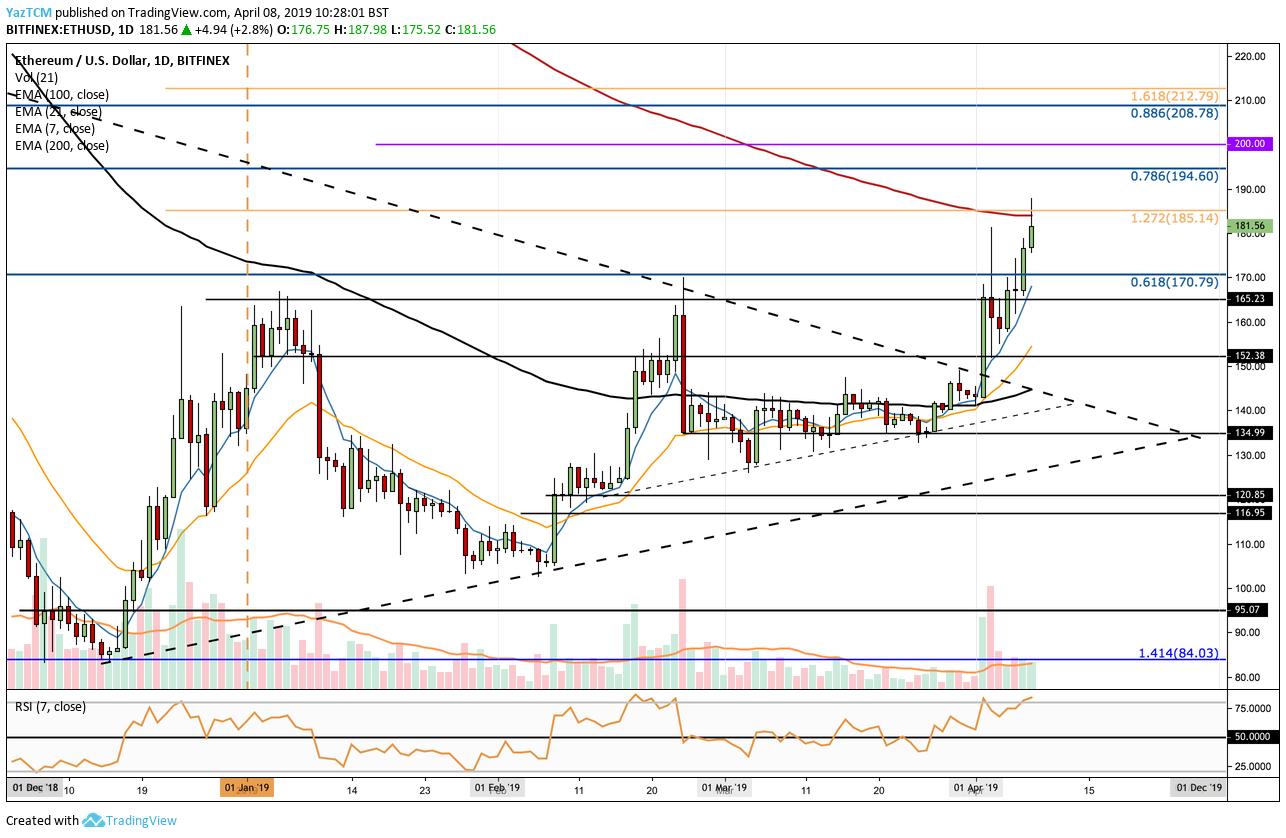
Taking a look at the ETH/USD chart above we can see that the market had broken out of the long term symmetrical triangle on April 1, 2019, well before the expected breakout by the ScienceGuy9489.
The market continued to surge during the first week of April, creating a fresh 2019 high above the $170 level. Price action has now recently run into expected resistance at a 1.272 Fibonacci Extension level (drawn in orange) priced at $185.14. This level of resistance is further bolstered by the 200 day exponential moving average (EMA – red line) as highlighted by ScienceGuy9489.
What Is The Current Short Term Trend?
The current short term trend is bullish. If price action was to fall beneath the $155 level, this would invalidate the bullish trend.
Where Is The Resistance Above The Market?
Above the $185 level we can expect initial higher resistance to be located at the bearish .786 Fibonacci Retracement level (drawn in blue) priced at $194.60. This bearish Fibonacci Retracement level is measured from the November 2018 high to the December 2018 low.
If the buyers continue to climb above $195, the next level of resistance is at the $200 level. Above $200, higher resistance is then located at the bearish .886 Fibonacci Retracement level located at $208. This is then followed with further resistance at the 1.618 Fibonacci Extension level at $212.
What If The Sellers Regain Control?
Alternatively, if the resistance at the 200 EMA proves to be too strong for the bulls, causing ETH/USD to fall, we can expect immediate support to be located at $170. Beneath $170, further support is expected at $165, $152 and $140.
What Are The Technical Indicators Showing?
The RSI has recently entered overbought conditions which could indicate that the market is overstretched. This combined with the fact that the market has now met resistance at the 200 EMA may add further to the suggestion that the market may fall slightly over the coming few days.
Conclusion
ScienceGuy9489 has been pretty accurate through his previous Ethereum price predictions. However, this time it seems that the market has broken out well before his expected breakout date.
His new prediction for Ethereum to reach $200, however, is a very strong possibility. This is provided that the market can break above the strong resistance at the 200 day EMA. Clearing the $185 level will indeed leave the market open to testing the $200 level once again.