
EOS has recently rebounded at the $6.00 level and has managed to remain above the support pretty comfortably. Over the past 24 hours of trading, EOS has risen by a further 2.34% to bring the current price for the coin up to around $6.43.
EOS may have seen a 16% price fall over the past 7 trading days, after the cryptocurrency dropped from a high around $8.58. However, EOS has seen a major price increase, totaling 32% over the past 30 days with a further 73% price explosion over the past 90 trading days.
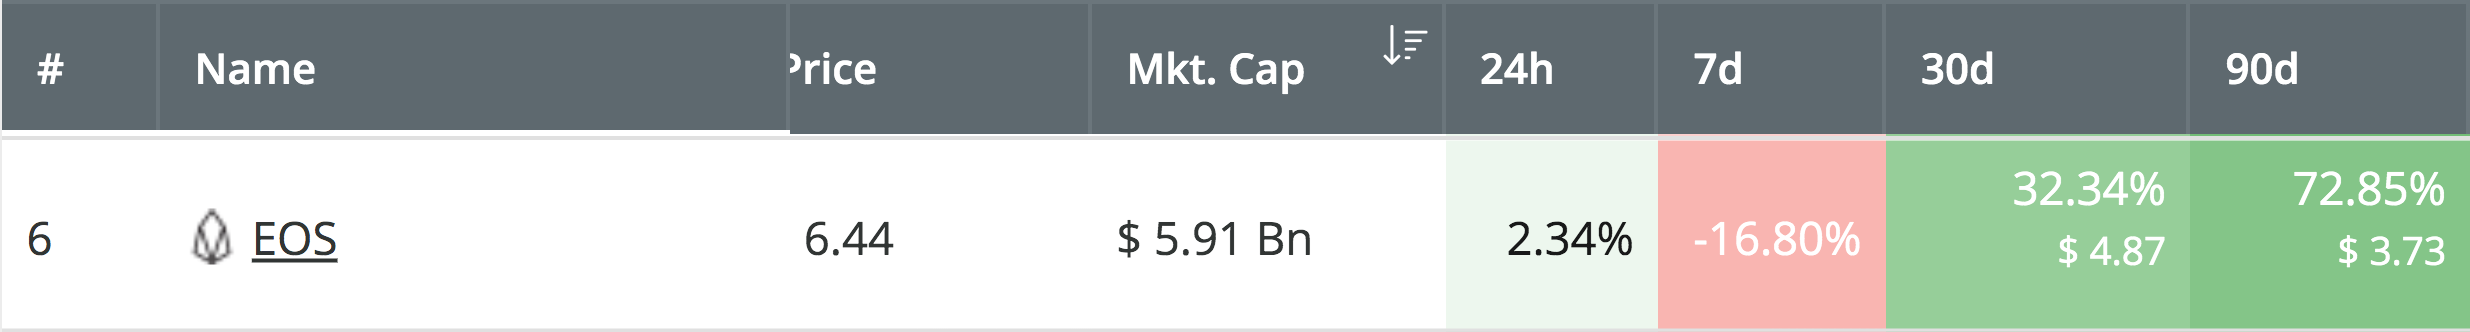
Source: CoinCheckup
The bounce to remain above $6.00 has now put EOS back on strong footing to continue to travel further higher. Some of the technical indicators are practically screaming “Buy!” at this current moment in time.
EOS is now ranked in 6th position amongst the top cryptocurrency projects by market cap, as it currently holds a $5.91 billion market cap value. Let us continue to analyze the EOS market and highlight some potential areas of support and resistance moving forward.
EOS Price Analysis
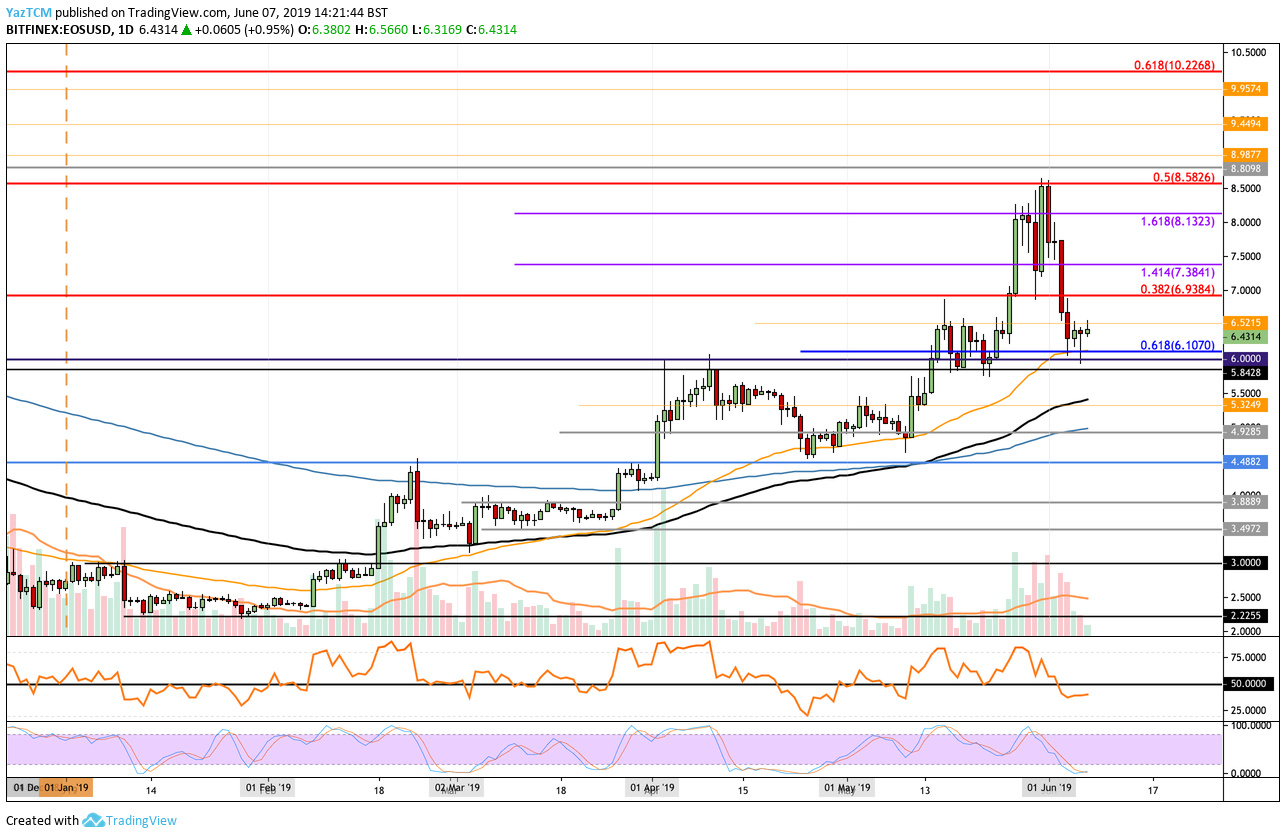
EOS/USD – MEDIUM TERM – DAILY CHART
What Has Been Going On?
Taking a look at the EOS daily chart above, we can clearly see the bulls defending the $6.00 mark very aggressively, not allowing price action to drop beneath. EOS has now bounced higher from $6.00, and is currently battling with resistance at the $6.50 level.
What Is the Current Trend?
The current trend for EOS remains bullish. However, this trend will be invalidated if EOS drops beneath the $6.00 support level.
Where Can We Go From Here?
If the bulls can continue to push EOS/USD above the resistance at $6.50, the next level of resistance above is then located at the bearish .382 Fibonacci Retracement level (drawn in red), priced at $6.94. This is measured from the June 2018 high to the December 2018 low.
If the buyers continue to push EOS above $7.00, further higher resistance then lies at $7.38, $8.13, and then at the bearish .5 Fibonacci Retracement level (drawn in red), priced at $8.58. This level of resistance proved to be strong during May 2018 and is therefore expected to provide strong resistance moving forward.
Above $8.58, further higher resistance can be found at $9.00, $9.44, $9.95, $10.00, and $10.22.
What Are the Technical Indicators Showing?
The Stochastic RSI is currently trading at extreme oversold levels, and is screaming to traders to buy. We are currently waiting for the indicator to produce a bullish crossover above signal, however, the support at $6.00 is very strong, which allows us to think EOS/USD will be traveling higher fairly soon.