
2018 has been an eventful year for cryptocurrencies. While many were predicting the surge of 2017 to continue into 2018, the reality has been quite the opposite. Despite the downturn, blockchain developers continue to develop their respective platforms for wider use cases and global adoption.
It is important to measure the facts and figures of the blockchain industry to understand the fundamental performance of the industry. CoinGecko has taken the initiative and responsibility to publish reports on the state of the crypto economy.
Earlier in the year, we did an analysis of their Q1 2018 report, showcasing some key data and relevant information. This time, we look at the Q2 report to see what we can observe, learn, and use as a basis for future decisions.
The Cryptocurrency Market Cap
Q2 2018 started with some gains in the crypto market, but those gains were short lived as the correction that began in Q1 2018 deepened further. The market cap grew from April into May, but then it steadily declined towards the end of May and in June, making the value almost the same as the beginning of the quarter. This can be seen from the chart below.
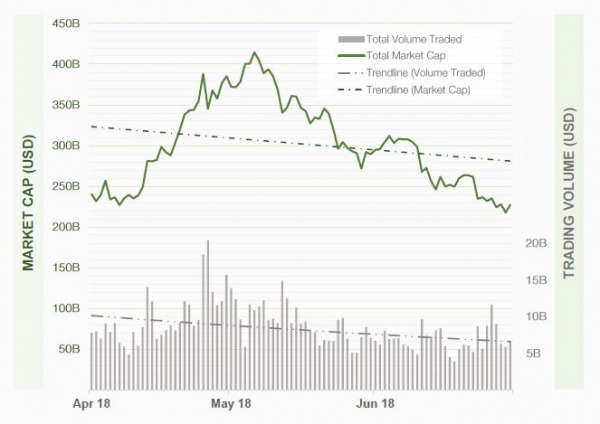
The crypto market cap reached a high of over $420 billion in May before a further dip to end the quarter with a market cap below $250 billion. The volume traded appears to be the determinant of the market cap chart, as spikes in volume traded is often followed by a surge in the market cap.
The top 5 coins on the crypto market (Bitcoin, Ethereum, Bitcoin Cash, Ripple, and EOS) are still up year-on-year. The total market cap is also up year-on-year by the end of Q2 2018.
Q2 Market Distribution
There was a lot of talk towards the end of 2017 in the crypto community about the dominance of Bitcoin in the coming years. Some even predicted that the value of Ethereum will overtake that of Bitcoin. But the reality is that the dominance of Bitcoin has only grown stronger so far. The dominance dipped during the highs of January 2018, but steadily picked up pace as the bear trend set in further. This shows a market sentiment that people trade their altcoins for bitcoins and prefer to hold bitcoins in a bear than altcoins.
In Q2 2018, the market dominance of Bitcoin dipped slightly when the market appeared to be recovering, but as the dip went further, the dominance of Bitcoin was seen to increase and get back around the levels it was when the quarter started.
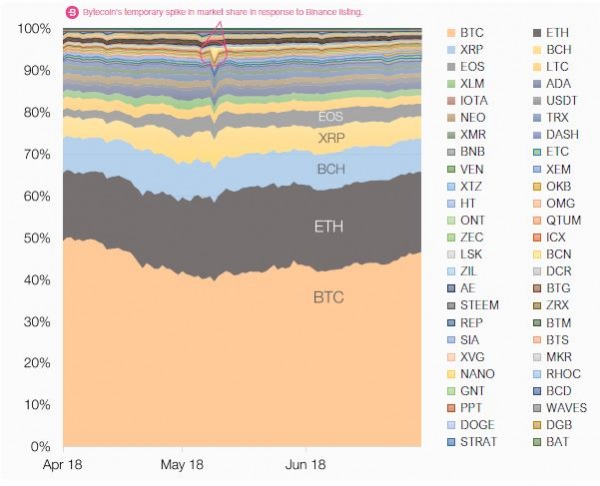
Bitcoin and Ethereum continue to dominate the market distribution. It can also be seen from the above chart that the top 5 coins are responsible for 80% of the crypto market cap.
Litecoin lost its place among the top 5 coins, with EOS taking its place. The big surge in the value of EOS is from the mainnet release as well as the token migration from the Ethereum blockchain to its own EOS blockchain.
Another coin with a notable market cap surge (among the top 20 cryptocurrencies) in this bear market is Tether (USDT). It moved up 15 places in Q1 2018 and then moved up 4 places further in Q2 2018. This is not surprising as it is a stable coin tied to the US dollar. More and more people have been trying to evade the devaluation of their crypto portfolio by owning more Tether.
Since the all-time-high in January 2018 to the end of Q2 2018, the average drop of cryptocurrencies is 77%, with Bitcoin dropping by as low as 69%, Ethereum dropping 70%, Zcash dropping 95%, Qtum dropping 92%, and Nano dropping 93%. The smallest drop among the top 50 coins was Tether with just 17%.
However, exchange coins like OKB, BNB, and Huobi Token have performed well in the bear market, dropping by significantly less than half of their value. This signifies that a fair amount of trading continues on the respective exchanges despite the bear market.
Q2 Exchange Market Dominance
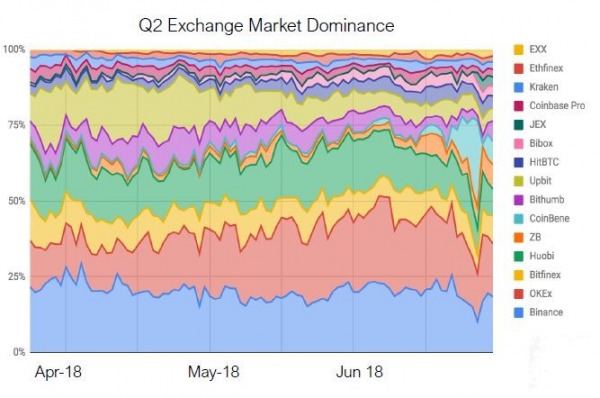
The exchange market is a very competitive space with various exchanges trying to attract traders to their platform. Binance, OKEx, Huobi, and Bitfinex have consistently stayed in the top 5 exchanges through Q2 as can be seen from the chart below.
The trade volume generally responds to price and price trends rather than the number of exchanges. The number of exchanges tracked by CoinGecko increased from 84 (at the start of Q2) to 144 (at the end of Q2).
This increase in the number of exchanges is not felt on the trade volume, however.
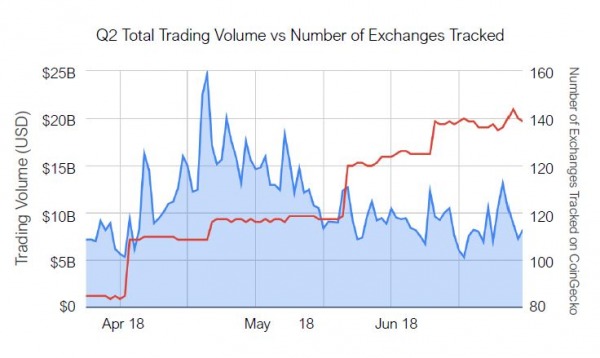
The red line signifies the number of exchanges tracked. Even though it increases, its impact is not felt on the trade volume. The observation in Q2 was that the top 3 exchanges were responsible for about 50% of the trade volume on crypto exchanges. This generally means more exchanges does not mean more volume. It must also be noted that over 97% of trading still occurs on centralized exchanges as of the end of Q2 2018.
Trade Volume, Bitcoin Price Correlation
Bitcoin is the market leader in the cryptocurrency market. When bitcoin price dips, it tends to drag the whole crypto market with it. Interestingly, most altcoins dip even more than bitcoin. This suggests that there is a relationship between trade volume and bitcoin price.
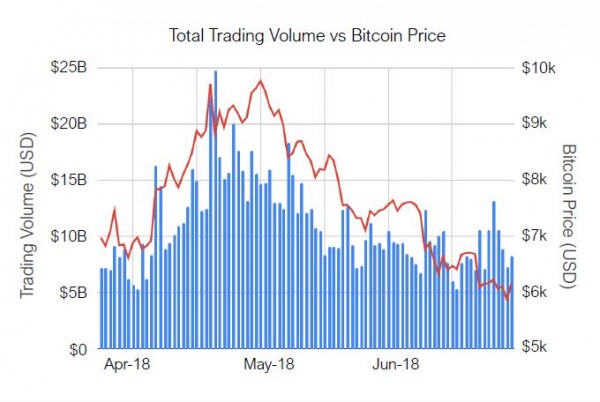
As it can be seen in the chart above, high trade volumes often result in a higher bitcoin price, whereas an unsustained height in the trade volume is often accompanied by a drop in the value of bitcoin. However, the reverse could also be the scenario in that higher bitcoin prices drives up the trade volume.
Q2 ICO Overview
A staggering 606 ICOs ended in Q2 2018. Only 339 of these ICOs publicly released the amount raised to the investors. It is a huge cause of concern that 44% of the 606 did not give any information about the amount raised. Only 75 of the completed ICOs were successfully listed on exchanges. Of all the ICOs, only 38 gave a positive ROI at peak valuation and 8 had to cancel their ICO and refund investors.
Over $7.7 billion was raised by ICOs during this period. This was lead by EOS raising $4.2 billion (which amounts to 53.5%). The amount raised by ICOs between April and June 2018 is expressed in the chart below.
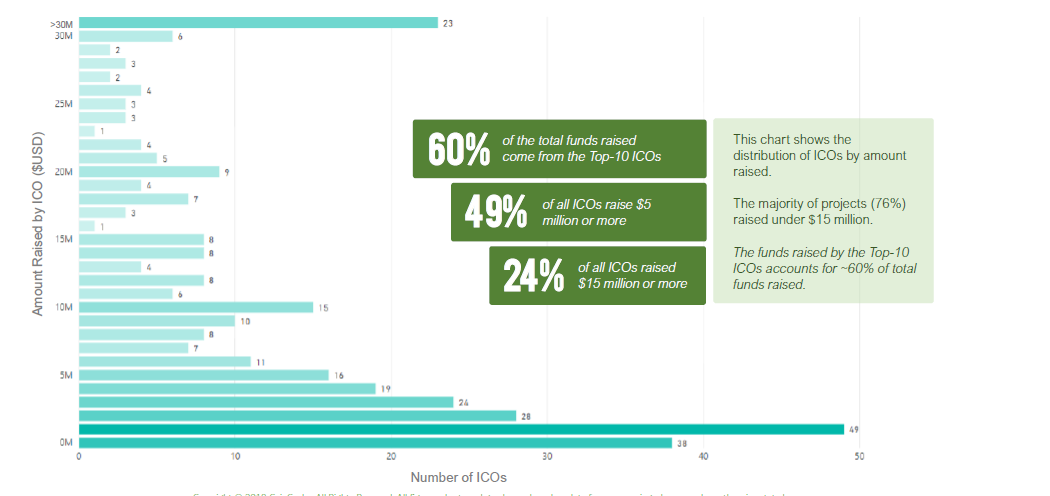
59% of the total number of ICOs came from the top 10 countries headed by Singapore, UK, USA, Estonia, Switzerland, and Russia. The top 10 countries were responsible for 84% of total ICO funding. This shows that the world of blockchain development is still concentrated in a few top countries.
Twitter Sentiment Analysis
Social media has brought the world together on a phenomenal scale. Crypto communities are established and grown online. One of the most famous social media outlets for crypto is Twitter. Twitter has been known to generate a lot of speculation and information for the crypto community, as many blockchain industry entrepreneurs, founders, developers, and traders use the platform as their primary means of communication.
English is by far the most preferred language on the platform, taking a significant 76%. In second place is Japanese which is at 4% of crypto tweets. Bitcoin and Ethereum are the two coins that receive the most mentions on Twitter. However, there is no direct correlation between tweets and market cap, although a spike in trade volume can be traced to Twitter when there is an information or rumor that affects that particular coin.
The chart below illustrates the number of tweets of the top 5 most mentioned coins on Twitter:
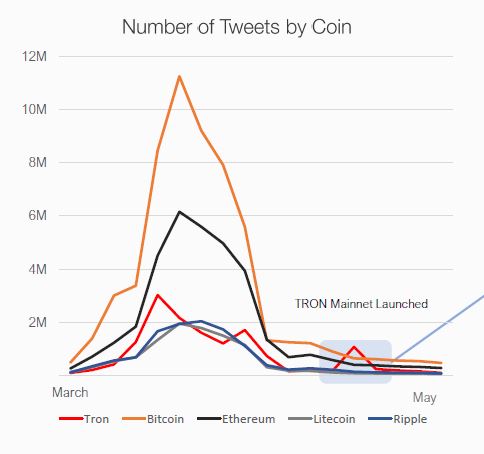
The sudden surge by Tron was during their mainnet launch because lots of accounts were tweeting multiple times. In an adjusted timeframe where number of tweeting accounts is considered over number of tweets, this spike is nonexistent as seen below:
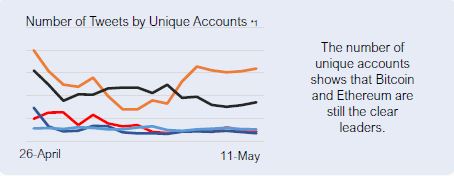
Generally, Bitcoin and Ethereum are very much ahead when it comes to sentiment analysis on Twitter. However, Tron and Aelf have a high number of tweets (mentions) coming from tweeting accounts unlike other coins which have a fairly low tweet-to-unique-account ratio.
Dapp Stats
Dapps is short for decentralized applications. It has been a buzzword in the crypto space since Ethereum launched. While there are a growing number of dapp platforms, Ethereum still remains the leader in the space. The use of dapps increased in Q2 2018 from what was recorded in Q1 2018, as seen in the chart below.
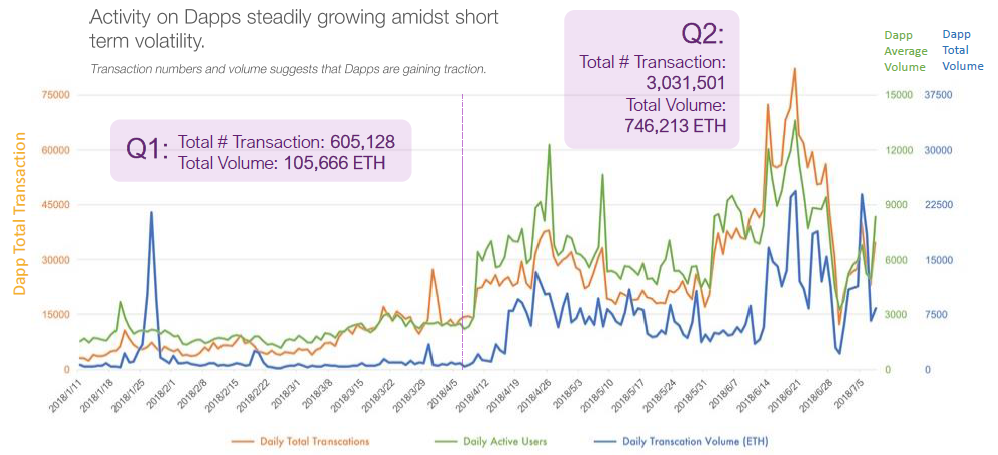
The adoption of dapps so far has been made easily possible by wallet/dapp browsers such as Metamask, Toshi, and Status. However, there is still a long way to go before dapps reach their full potential in adoption.
Conclusion
The correction in Q1 2018 was necessary after the massive bull runs of late 2017. Q2 saw a brief rise in value which was then followed by another dip. The market seems to be unable to break out convincingly from the bear trend—however, there has been a number of fundamental developments in the crypto space despite this drop.
Crypto regulations are beginning to take shape as an SEC official in an open discussion gave the opinion that Ethereum is not a security, though some cryptocurrencies could be classified as securities.
The current trends does not suggest a bull run any time soon—however, it is a known fact that those who got in at the bear most enjoys the bull. There is still no cure for volatility in the crypto market. This is a reminder for traders and investors to stay cautious even while being optimistic.
For more insights on the crypto market in Q2 2018, see the full report from CoinGecko.
Related: Crypto Crash: Why Have Cryptocurrencies Been Going Down Lately?