
The cryptocurrency markets are currently going through a much-needed retracement period, after Bitcoin fell from above $9,000 to trade beneath $8,000. However, the recent increases seen within the cryptocurrency industry leaves us in a strong position as we approach Q3.
With little under a month left in Q2, we decided to take a look ahead and see if Ripple could potentially hit the $0.75 level in Q3 2019.
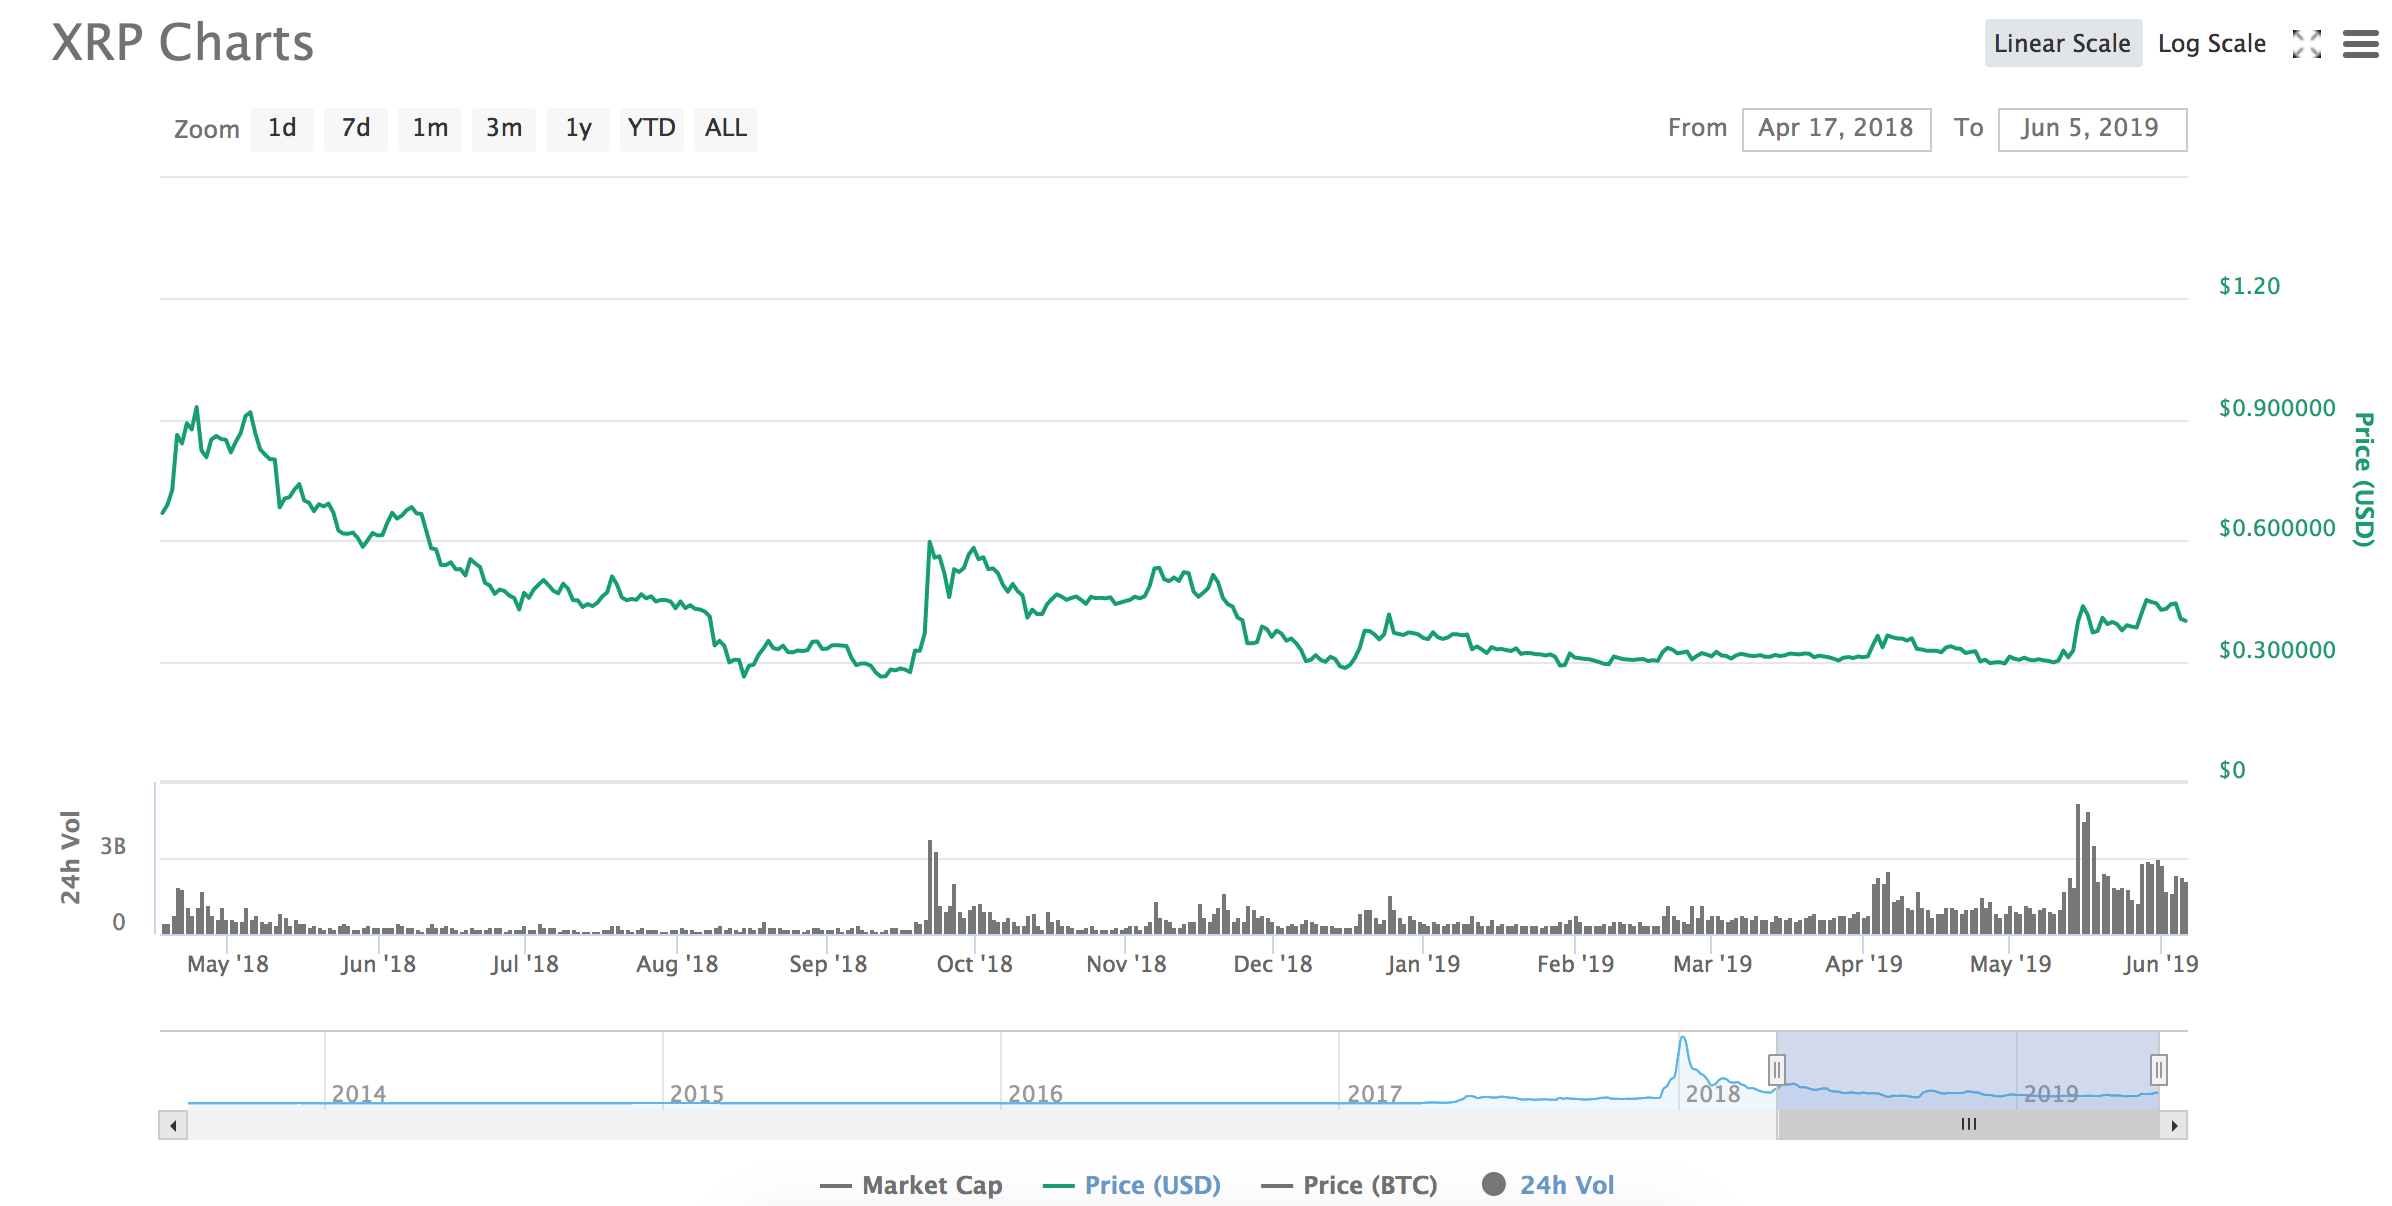
Source: CoinMarketCap
In May 2019, Ripple managed to break up out of its previous sideways trading motion to penetrate back above the $0.40 level. Before this, Ripple had done very well in 2019 to hold the support at the $0.30 level from January 2019 to April 2019.
Ripple may have seen a precipitous 10% price fall over the past 7 trading days, but the cryptocurrency is still up by a total of 31% over the past 30 trading days, allowing the bulls to enter into a bullish trading condition.
Ripple is currently ranked in the 3rd position in the market cap rankings, as it currently holds a $16.93 billion market cap valuation. However, there has been some recent evidence to suggest that Ripple possibly has a much higher market cap value.
For Ripple to reach the $0.75 level, the cryptocurrency will need to increase by a total of 87% from the current price. The last time that Ripple was at the $0.75 level was during May 2019.
Let us continue to take a look at the XRP/USD market and highlight some potential areas of resistance on the way up toward the $0.75 level.
Ripple Price Analysis
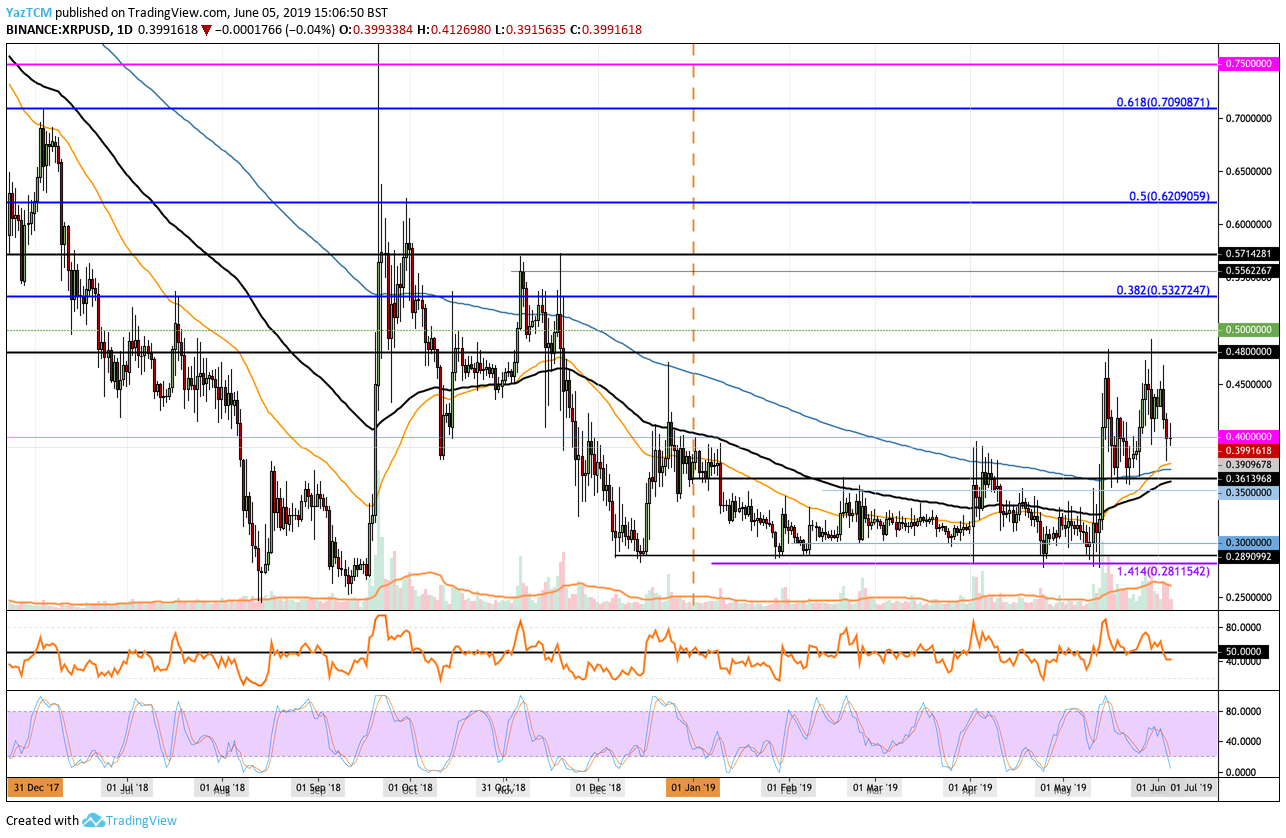
XRP/USD – MEDIUM TERM – DAILY CHART
What Has Been Going On?
Analyzing the daily XRP/USD chart above, we can clearly see Ripple breaking above the sideways trading condition during May 2019, after price action smashed above the $0.40 level. However, Ripple was unable to overcome the resistance at the $0.48 level and has since returned to the support around $0.40.
Where Is the Resistance On the Way Toward $0.75?
If the bullish pressure can resume, pushing Ripple higher, we can expect immediate resistance above the market to be located at the $0.48 and $0.50 levels. Above this, higher resistance lies at the bearish .382 Fibonacci Retracement level (drawn in blue), priced at $0.5327. This long-term bearish Fibonacci Retracement level is measured from the April 2018 high to the December 2018 low.
Above this, higher resistance is then expected at $0.55 and $0.60. Above $0.60, further resistance then lies at the bearish .5 Fibonacci Retracement level (drawn in red), priced at $0.6209. Resistance above this is then located at $0.65 and $0.68.
Before being able to test the target level at $0.75, the buyers will need to overcome resistance at the bearish .618 Fibonacci Retracement level (drawn in blue), priced at $0.7090. If they can clear this resistance, they will be free to make an attempt at the $0.75 level.
Conclusion
Although it is still a steep 87% price increase away, Ripple certainly has the potential to rise during Q3 2019 and reach the target level of $0.75. However, the cryptocurrency will need to contest significant resistance at the $0.53, $0.63, and $0.70 levels before being free to attempt the $0.75 level.