
Ethereum has performed pretty well during 2019. After bucking the previous bearish trend and reversing around the $85 level, ETH climbed back above the $100 price level. Over the past 3 months, Ethereum has gone on to increase by a total of 76%, bringing the current price for the cryptocurrency up to the $240 level.
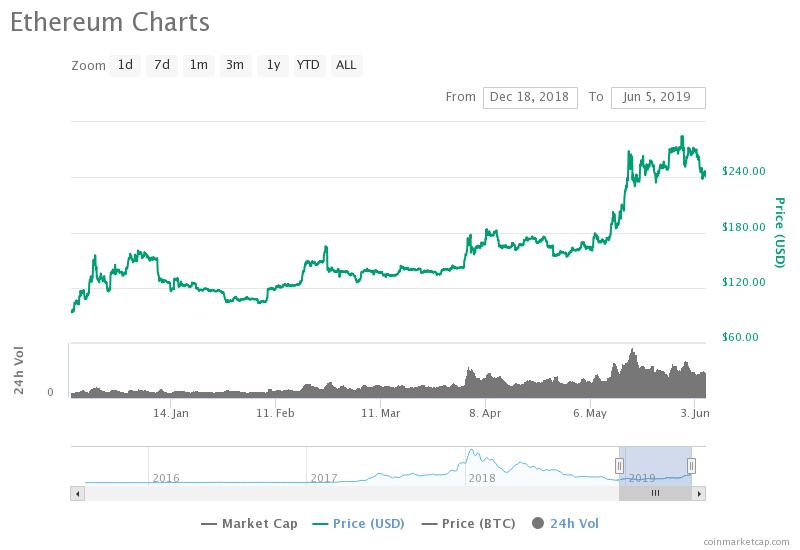
Source: CoinMarketCap
In this article, we will take a look at the potential for Ethereum to increase further and reach the $500 level before the end of Q3 2019. For Ethereum to reach the price target of $500, it must increase by a total of 105% from the current trading price. This will be a difficult task for Ethereum to achieve, but the market still has until the end of September 2019 to achieve this.
In May 2019 alone, Ethereum managed to increase by a total of 72% from low to high, which helps the case to believe Ethereum could increase by 105% over the next 4 months. Ethereum is currently ranked in 2nd position amongst the top cryptocurrency projects by market cap value, as it currently holds a $25.88 billion market cap.
Let us take a look at the ETH/USD market and highlight some potential areas of resistance on the way up toward $500.
Ethereum Price Analysis
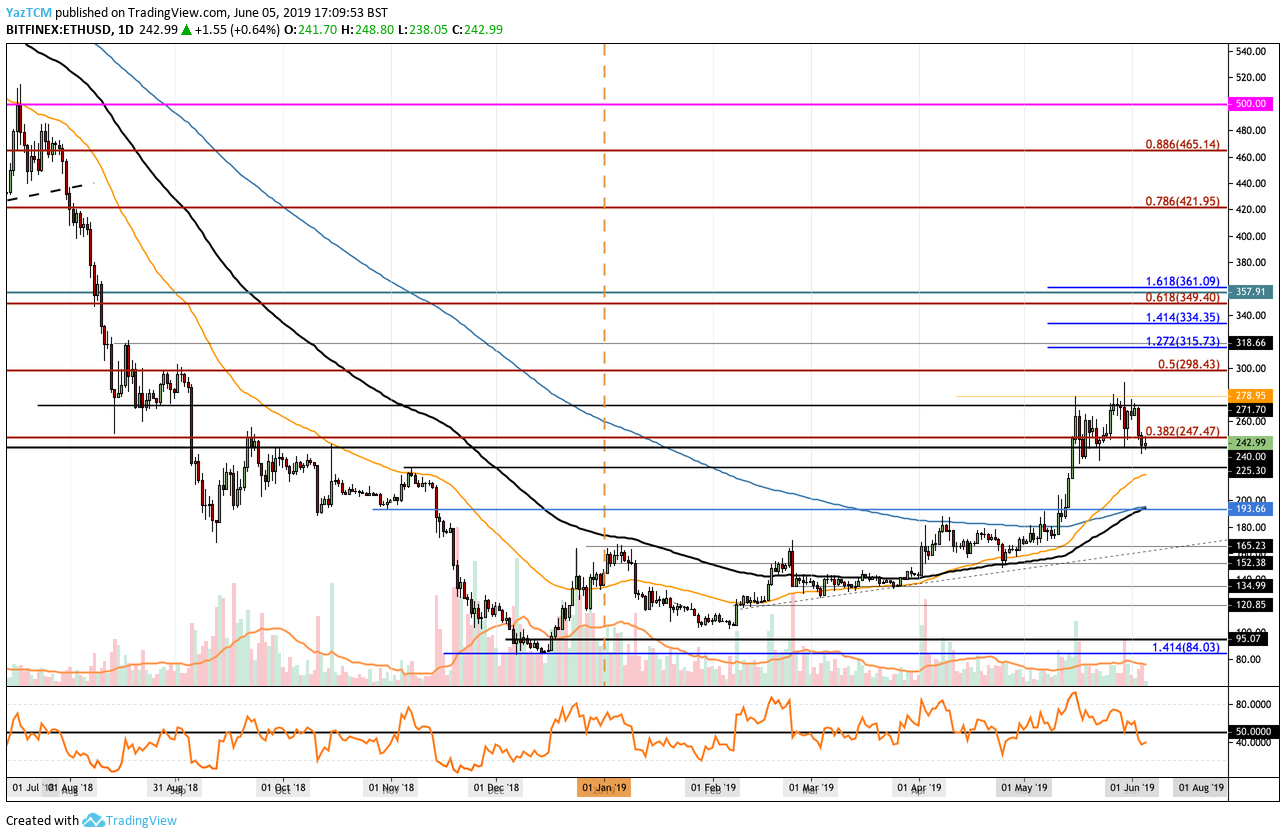
ETH/USD – LONG TERM – DAILY CHART
What Has Been Going On?
Ethereum has recently rolled over and dropped from the resistance at the $278 level to where it is currently trading at the $240 support level. The cryptocurrency has been on a tear recently, and in May 2019 the market signaled a Golden Crossover – a very strong bullish signal – when the 50-day EMA crossed up above the 200-day EMA.
Where Is the Resistance Toward $500?
When the buyers regroup and start to push ETH/USD higher, we can expect immediate resistance above to be located at $278. Above this, higher resistance is then located at the long-term bearish .5 Fibonacci Retracement level (drawn in red) priced at $298.43. This long-term bearish Fibonacci Retracement is measured from the July 2018 high to the December 2018 low.
Above $300, further higher resistance is located at the short-term 1.272 and 1.414 Fibonacci Extension levels (drawn in blue), priced at $315 and $334, respectively. This is then followed up with higher resistance at the bearish .618 Fibonacci Retracement level (drawn in red), priced at $349.
If the bullish pressure continues above $350, further higher resistance is then located at $380 and $400. Above $400, we can expect resistance at the bearish .786 and .886 Fibonacci Retracement levels (drawn in red), priced at $421.95 and $465, respectively. If the buyers can clear this, they will be clear to make an attempt at the $500 target level.
Conclusion
Ethereum has already experienced a superb price run in 2019 after the market managed to increase by a total of 76% over the past 3 months alone. If the bullish run continues within Bitcoin, we can expect Ethereum to continue to travel much further higher and possibly test the $500 target level before the end of Q3 2019.
To reach the $500 target level, Ethereum will need to overcome resistance at $300, $350, $400, $421, and $465 before being clear to make an attempt for $500.