
- The project lead has recently spoken about the complexities surrounding the entire cryptocurrency industry.
- The DCR/USD market is now trading within a trading range between $20.95 – $14.66.
- Support moving forward: $17.87, $16.19, $15.00, $14.66, $12.00, $10.00
- Resistance moving forward: $29.95, $24.06, $26.95, $28.37, $30.16, $35.10.
Latest Decred News
Jake Yocom-Piatt, the project lead for Decred, recently wrote an interesting article on CoinDesk, where he alluded to the complexities within the cryptocurrency industry and provided some of his own solutions to combat them.
He began by outlining complexities for both investors and projects. The problem for investors is that the information available is “bi-modal,” as he put it — in that the minority of investors are well-informed and the majority are uninformed.
The uninformed investors continue to chase the profit with their goal to buy low and sell high. However, the informed investors remain patient and diligent in knowing that their investments are for the long term, and that their investments can act as a store of value in the long term if they resist the urge to liquidate their positions.
These two types of investors clash and cause extreme volatility within the market.
Some of the solutions presented by Yocom-Piatt for investors included doing your own research (DYOR) instead of listening to other second-hand investment advice, staying skeptical about grandiose promises made by project, and dollar-cost averaging their investments.
Yocom-Piatt also explained the complexities for projects, which he believes is also bi-modal — the minority of projects keep their promises in line with what they can deliver and the majority over-promise on a regular basis.
In such an unregulated sector, it is extremely easy to over-promise on undeliverables with no oversight. He related this to Decred’s off-chain time-ordered filesystem, Politeia, explaining that a handful of simple components can easily turn into a complex task.
Some solutions offered toward projects are to avoid over-promising and reducing complexity by keeping project goals simple.
Let us continue to take a look at the Decred market over the recent term and highlight any areas of potential support and resistance.
DCR Price Analysis
Decred has seen a price increase totaling 4.64% over the past 24 hours of trading as the market now trades at a price around $18.67, at the time of writing.
Decred is now ranked in 33rd position and presently retains a $166 million market cap value.
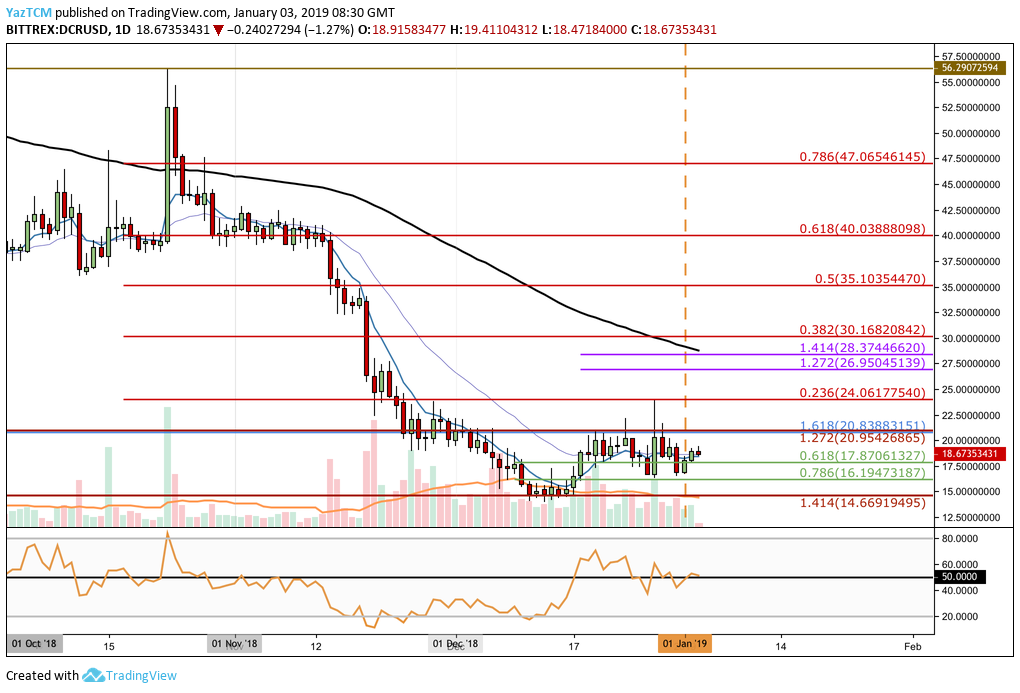
Analyzing DCR/USD from the daily chart above, we can clearly see the damage caused by the November 2018 cryptocurrency bloodbath. Decred has lost a total of 55% over the past 90 trading days.
The bearish market came to a halt in December 2018 as price action had found support at a downside 1.414 Fibonacci Extension level (drawn in red) priced at $14.66.
DCR/USD rebounded from this level but met resistance at the downside 1.272 Fibonacci Extension level (drawn in red) priced at $20.95. The market has been trading within this range ever since rebounding.
Trend: Neutral
The DCR/USD market is now in a period of consolidation as it continues to trade within the range between $20.95 and $14.66.
For the DCR/USD market to be considered bullish, we would need to see the market break above the $24.06 handle.
We would need to see price action breaking below the lower boundary of the trading range for the market to be considered bearish.
Where is the Resistance for DCR Above $20.95?
If the buyers can push price action above the upper boundary of the trading range, we can expect immediate resistance toward the upside to be located at the bearish .236 Fibonacci Retracement level (drawn in red) priced at $24.06.
Price action had attempted to break above this level previously but the attempt was rejected. This Fibonacci Retracement level is measured from the high seen during October 2018 to the recent low seen during December 2018.
If the bulls can continue to press higher above $24.06, further higher resistance can be located at the short-term 1.272 and 1.414 Fibonacci Extension levels (drawn in purple), priced at $26.95 and $28.37 respectively.
More resistance toward the upside can then be expected at the bearish .382 and .5 Fibonacci Retracement levels (drawn in red), priced at $30.16 and $35.10 respectively.
Where is the Support Beneath the Market?
If the sellers begin to drive price action lower, we can expect immediate support beneath to be located at the short-term .618 and .786 Fibonacci Retracement levels (drawn in green), priced at $17.87 and $16.19 respectively.
Further support below will be expected at the lower boundary of the trading range at the downside 1.414 Fibonacci Extension level (drawn in red) priced at $14.66.
What are the Technical Indicators Showing?
The RSI is currently trading along the 50 handle, indicating the indecision within the market at this moment in time. This is evidenced by the trading range that we are currently within.
If the RSI can break toward the upside above 50, we could expect DCR/USD to climb higher.