
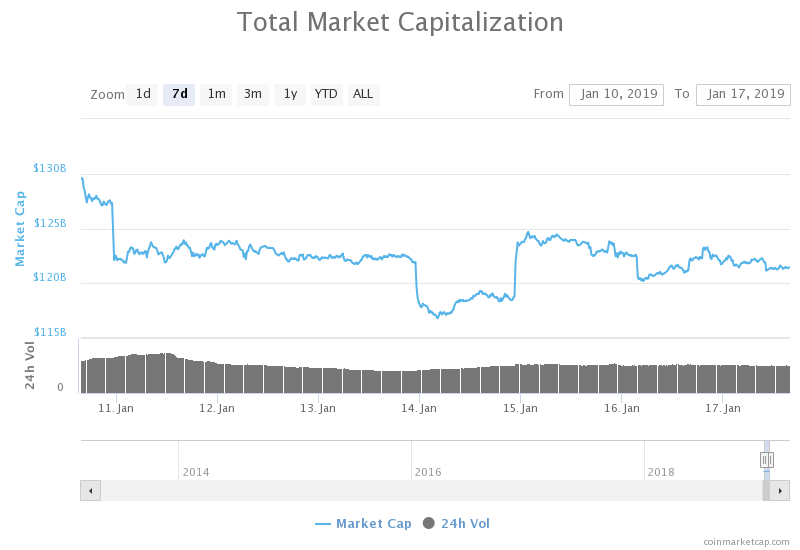
- The current market cap for the entire industry is now sitting at around $121 billion.
- Bitcoin had recently broken below the support at $3701.
- Support moving forward: $3,569, $3,508, $3,468, $3,406, $3,352, $3,266, $3,228.
- Resistance moving forward: $3,664, $3,701, $3,800, $3,851, $4,001, $4,215, $4,342.
Latest Bitcoin News
Over the past few days, the price of Bitcoin had dropped below the support identified around the $3,700 handle to where it is currently trading around the $3,650 level.
The total market cap for the entire cryptocurrency industry now sits at around $121 billion after reaching a low just beneath the $117 billion handle earlier in the week.
This price drop comes after news of a hack of the New Zealand-based Cryptopia Altcoin Exchange. The hack had occurred on January 14, 2019 and Cryptopia is officially the first exchange to have been hacked in 2019.
The hack had reportedly caused the exchange to become the victim of a $3.6 million theft and is now being investigated by the New Zealand police.
In other Bitcoin news, it has come out that a small 0.7% of all the Bitcoin addresses in circulation is currently controlling over 86% of the entire Bitcoin supply, which equates to roughly around $62 billion of the total market cap value. The re-evaluation of Bitcoin whales and their potential impact may start to bring fear into the market sentiment.
Let us continue to take a look at the BTC/USD market and proceed to highlight any potential areas of support and resistance moving forward.
BTC Price Analysis
Bitcoin has lost a small 0.42% over the past 24 hours of trading, bringing the current exchange price down to around $3,653, at the time of writing. The market has lost a further 8.56% over the past 7 trading days but is still up by a total of 5.02% over the past 30 trading days.
The number 1 cryptocurrency currently holds a $63.55 billion market cap after losing 43% over the previous 90 trading days. The 69-month old veteran is now trading at a value that is 81% lower than the all-time high price.
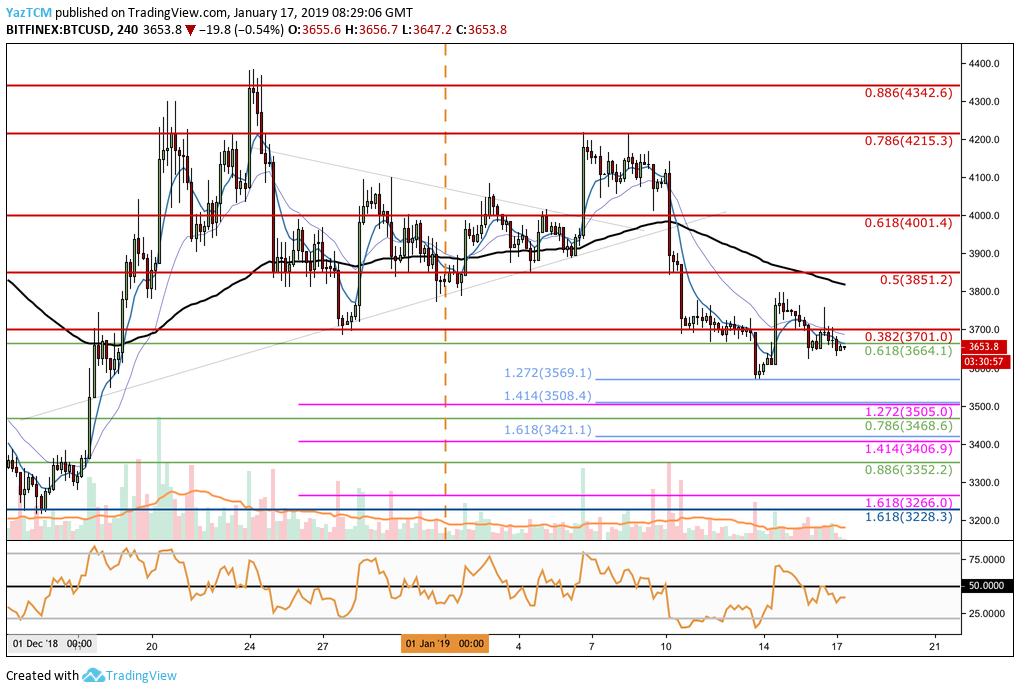
Analyzing the market from the 4-hour perspective above, we can see that since our last BTC analysis, price action has fallen through our highlighted support at the bearish .382 FIbonacci Retracement level (drawn in red) priced at $3,701.
The market continued to fall but eventually reached support at a short-term downside 1.272 Fibonacci Extension level (drawn in blue) priced at $3,569.
After reaching this level of support, the market then proceeded to rebound but was unable to overcome resistance at $3,800 and began to decline once again.
BTC/USD is now trading marginally below the resistance provided by the short-term .618 Fibonacci Retracement level (drawn in green) priced at $3,664.
Trend: Bearish
The break below the $3,701 handle has rendered the market into a short-term bearish trading condition. If price action continues to create another low beneath the $3,569 handle, we could expect BTC/USD to head further lower.
For this market to become bullish in the short term, we would need to see price action break back above the $3,800 handle.
Where is the Support for BTC Beneath the Market?
If the sellers continue to pressure the price action to head lower, we can expect immediate support towards the downside to be located at the short-term downside 1.272 Fibonacci Extension level (drawn in blue), priced at $3,569.
Support beneath this can be expected at the short-term downside 1.414 Fibonacci Extension level (drawn in blue) priced at $3,508. This level of support is further bolstered by another medium-term downside 1.272 Fibonacci Extension level (drawn in pink) priced at $3,505.
If the bears continue to push price action below the $3,500 handle, further support below is located at the short-term .786 Fibonacci Retracement level (drawn in green) priced at $3,468. This is closely followed by more support at the medium-term downside 1.414 Fibonacci Extension level (drawn in pink) priced at $3,406.
More support below $3,400 can then be expected at the short-term .886 Fibonacci Retracement level (drawn in green) priced at $3,352. There is more support at the medium-term downside 1.618 Fibonacci Extension level (drawn in pink) priced at $3,266.
The final level of support to highlight is located at the previous long-term downside 1.618 Fibonacci Extension level (drawn in dark blue) priced at $3,228.
Where is the Resistance Towards the Upside?
If the bulls can regroup and push the market above the resistance at $3,664, we can expect higher resistance at the bearish .382 Fibonacci Retracement level (drawn in red), priced at $3,701.
If the buyers can continue to press higher, further higher resistance can be located at the bearish .5 and .618 Fibonacci Retracement levels (drawn in red), priced at $3,851 and $4,001 respectively.
If the bullish pressure can then cause BTC/USD to climb above the $4,001 handle, more resistance above can be expected at the bearish .786 and .886 Fibonacci Retracement levels (drawn in red), priced at $4,215 and $4,342 respectively.
What are the Technical Indicators Showing?
The RSI on the 4-hour chart had recently broken below the 50 handle which indicates that the bears are now in possession of the market momentum.
If the RSI continues lower, we can expect BTC/USD to head toward the $3,569 handle once again.
Conclusion
Although Cryptopia is relatively small exchange, any hack can start to bring fear to the market. The support at the $3,569 handle will be crucial for the bulls to defend to prevent BTC price action from heading further lower.