
The recent Bitcoin surge has managed to push the market to fresh 4-month highs above the $5200 level. The cryptocurrency has surged by 6% over the past 7 days with a further 33% price increase over the past 30 days, which has brought the 71 month old project’s market cap value up to $92.79 billion.
However, typically when assets rise quickly the market tends to become exhausted, which usually results in a retracement or a pullback into an area where supply meets demand. Within Bitcoin the RSI has started to show signs that the market may be overbought and could be reaching exhaustion in the next couple of days.
The RSI is a technical indicator which represents how overbought or oversold a market may be. If the RSI is over the 70 threshold it is in overbought conditions, whereas if it is over the 80 level it is extremely overbought. Similarly, if the market is under the 30 level it is oversold and is extremely oversold beneath 20.
The RSI for Bitcoin has recently reached extreme overbought conditions above the 80 level. In fact, the RSI is at such an extreme overbought condition that hasn’t been seen since December 2017 when the market was just about ready to crash.
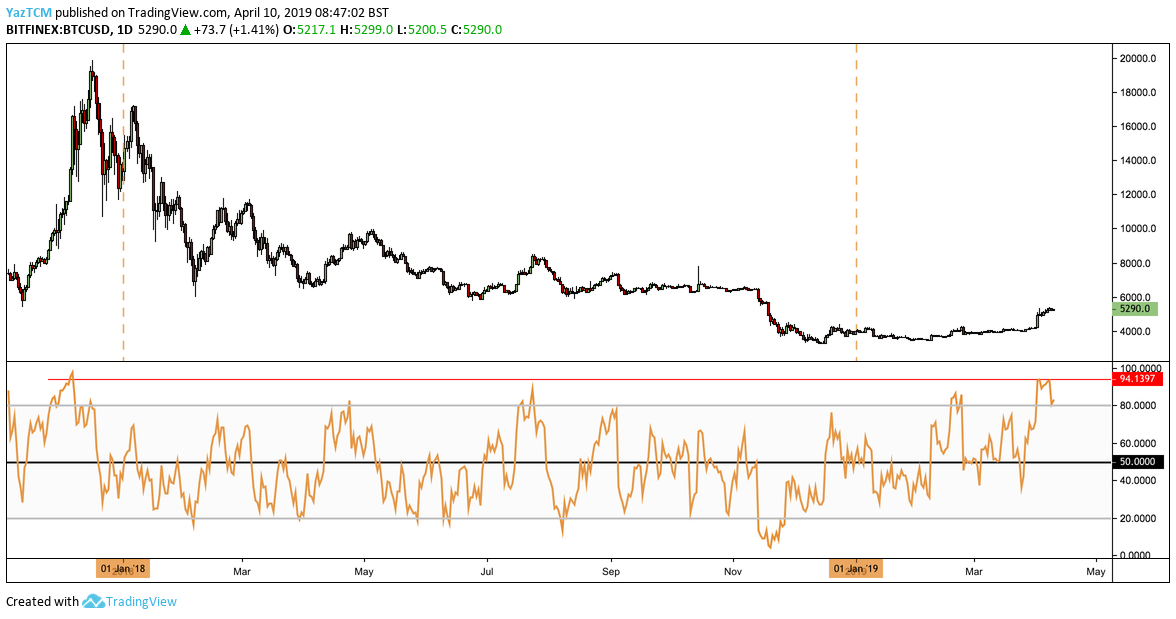
The chart above shows the RSI for Bitcoin since December 2017. We can see that in December 2017, the RSI had reached a level of 98 which had indicated that the market was extremely overbought. Nevertheless, after producing this signal, BTC/USD continued to increase by a total of 14% to reach the all time high before the market crashed.
We can also see that the recent price surge has now caused the RSI to reach a level of 94, an extremely overbought condition that hasn’t been seen since December 2017. The RSI has dropped since hitting the 94 level and is now resting at the 80 level. However, it is still important to not ignore this signal as it could be suggesting that a small retracement may be on the cards before Bitcoin can continue to climb higher and break above the $6000 level.
Despite the fact that the RSI is overbought on the daily chart, on the weekly chart the RSI has recently only just climbed above the 50 level which indicates on a long term basis, the market is still in bullish territory and not overbought.
Bitcoin Price Analysis
BTC/USD – SHORT TERM – DAILY CHART
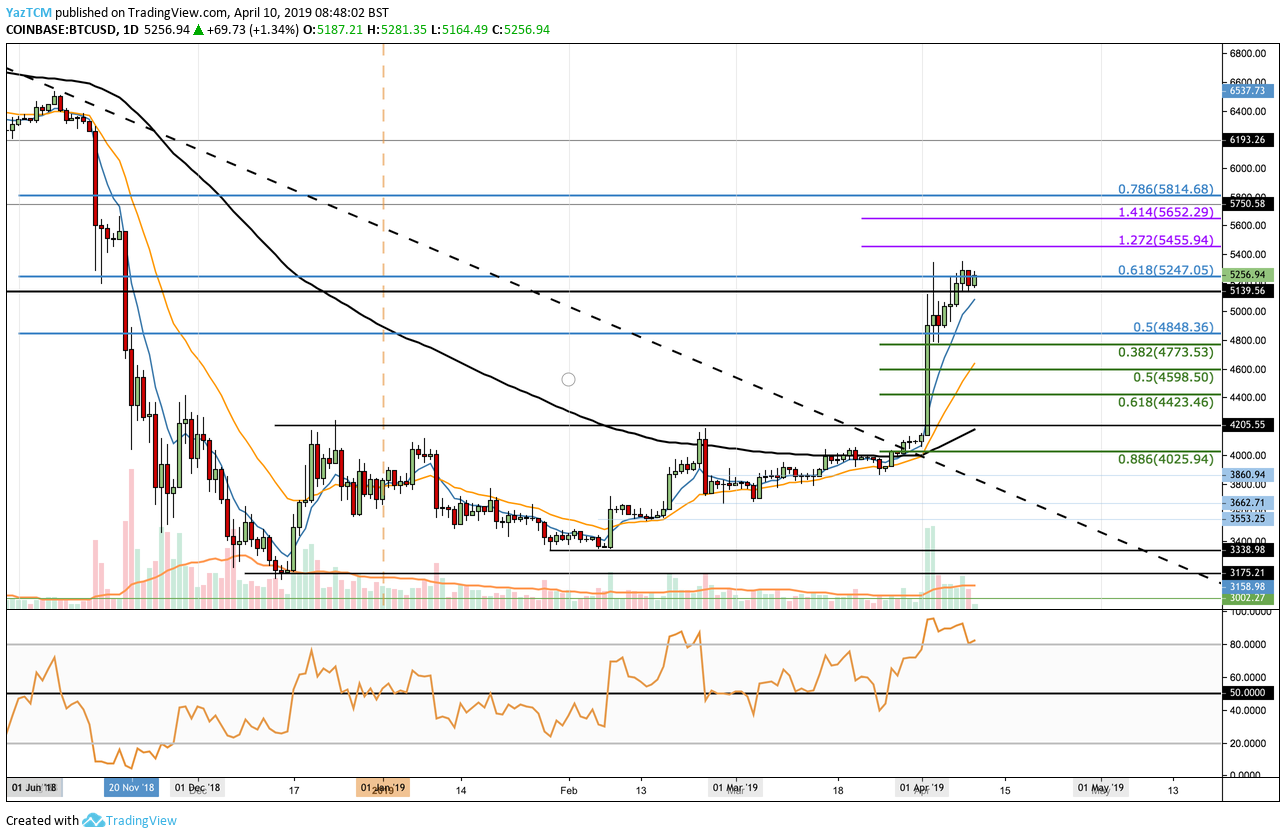
Taking a look at the BTC/USD chart above, we can see that the recent price surge has caused Bitcoin to rally into resistance provided by a bearish .618 Fibonacci Retracement level (drawn in blue) priced at $5247. This bearish Fibonacci Retracement level is measured from the November 2018 high, before the market bloodbath to the December 2018 low.
This level of resistance is strong enough to suggest that the bulls may struggle to break above here, especially if the RSI is indeed oversold.
If The Market Retraces, Where Is The Support?
In the case that the bullish pressure fades, causing the market to pull back, we can expect immediate support toward the downside to be located at the $5000 level. Beneath $5000, further support is then located at the short term .382 and .5 Fibonacci Retracement levels (drawn in green) priced at $4773 and $4598, respectively.
If the pullback continues to fall further deeper, we can then expect more support for Bitcoin at the .618 Fibonacci Retracement level (drawn in green) priced at $4423. This is closely followed up with more support at $4205 and $4000.
What If The Bulls Keep The Pressure On?
Alternatively, if the bulls continue to cause BTC/USD to drive further higher, we can expect initial resistance above to be located at the short term 1.272 and 1.414 Fibonacci Extension levels (drawn in purple) priced at $5455 and $5652, respectively.
Above this, further resistance can then be located at the bearish .786 Fibonacci Retracement level (drawn in blue) priced at $5813.
What Is The RSI Reading Suggesting?
The fact that the RSI has fallen slightly and rebounded at the 80 level indicates that the bullish drive may still be alive, at least for the next couple of days. If the RSI can continue to rise away from the 80 level we can expect the market to continue to surge.
Alternatively, if the RSI does fall beneath the 80 level, we can expect the market to retrace. The bullish trend will remain active so long as the RSI can remain above the 50 level after the drop beneath overbought conditions.
The falling volume could also be suggesting that the market is struggling to make headway above the current resistance levels which may result in a potential pullback.
Conclusion
The fact that the RSI has reached extreme overbought conditions really does suggest that a potential pullback is on the cards over the next few days, however, we expect this retracement to be short and sweet. If the RSI does drop beneath the 80 level we could see Bitcoin drop back toward the $5000 support or even lower.
However, it is important to remember that markets, particularly FX markets, have the ability to stay in overbought conditions for a very long time. Therefore it is essential to make your trading decisions based off of a combination of indicators and not just the RSI level.