
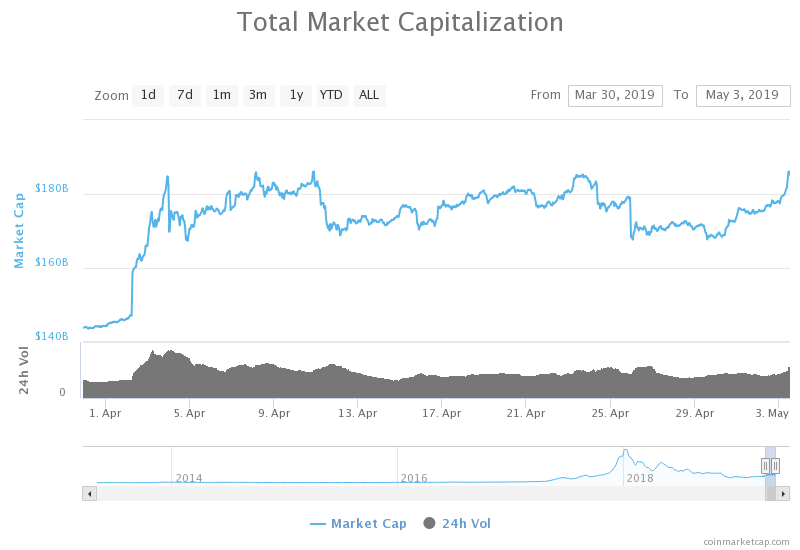
The cryptocurrency surge continues this week after Bitcoin continued to climb further higher to reach a high of $5,795. The recent price surge has now allowed the market cap for Bitcoin to break above the $100 billion level again, and for the market cap of the entire industry to reach a height of around $186 billion. In April 2019 alone, the entire cryptocurrency market cap gained over $41 billion:
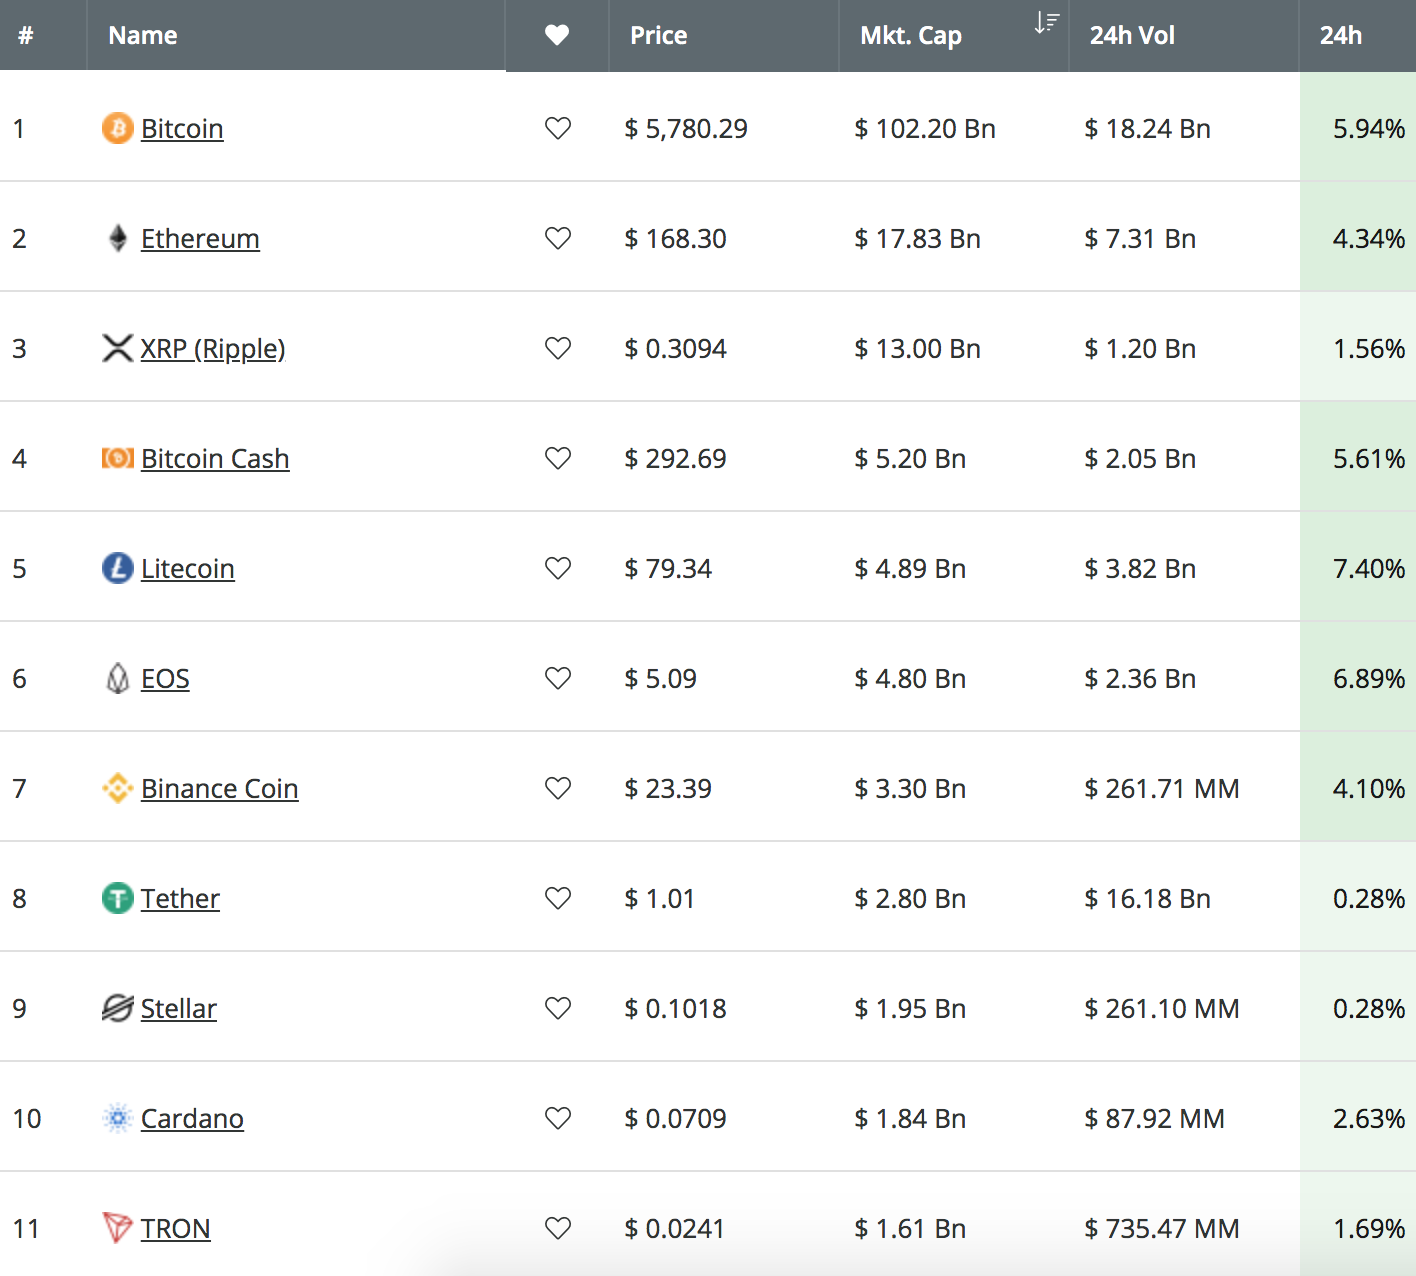
The recent price surge for Bitcoin has also helped the rest of the top 10 ranked cryptocurrency projects, with the entire roster in the green today. Litecoin and EOS are leading the way over the past 24 hours of trading, with price increases that amount to 7.4% and 6.89%, respectively. This is then followed by Bitcoin (5.94%) and Bitcoin Cash (5.61%).
Despite the recent price increases, we must remember that Bitcoin is not within a bullish trading condition until it rises 2x from the previous bottom. This means that Bitcoin needs to break above $6,350 before we can consider the market to be bullish overall.
Let us take a look at the charts for the top cryptocurrency projects and highlight some areas of support and resistance moving forward.
Bitcoin
BTC/USD – MEDIUM TERM – DAILY CHART
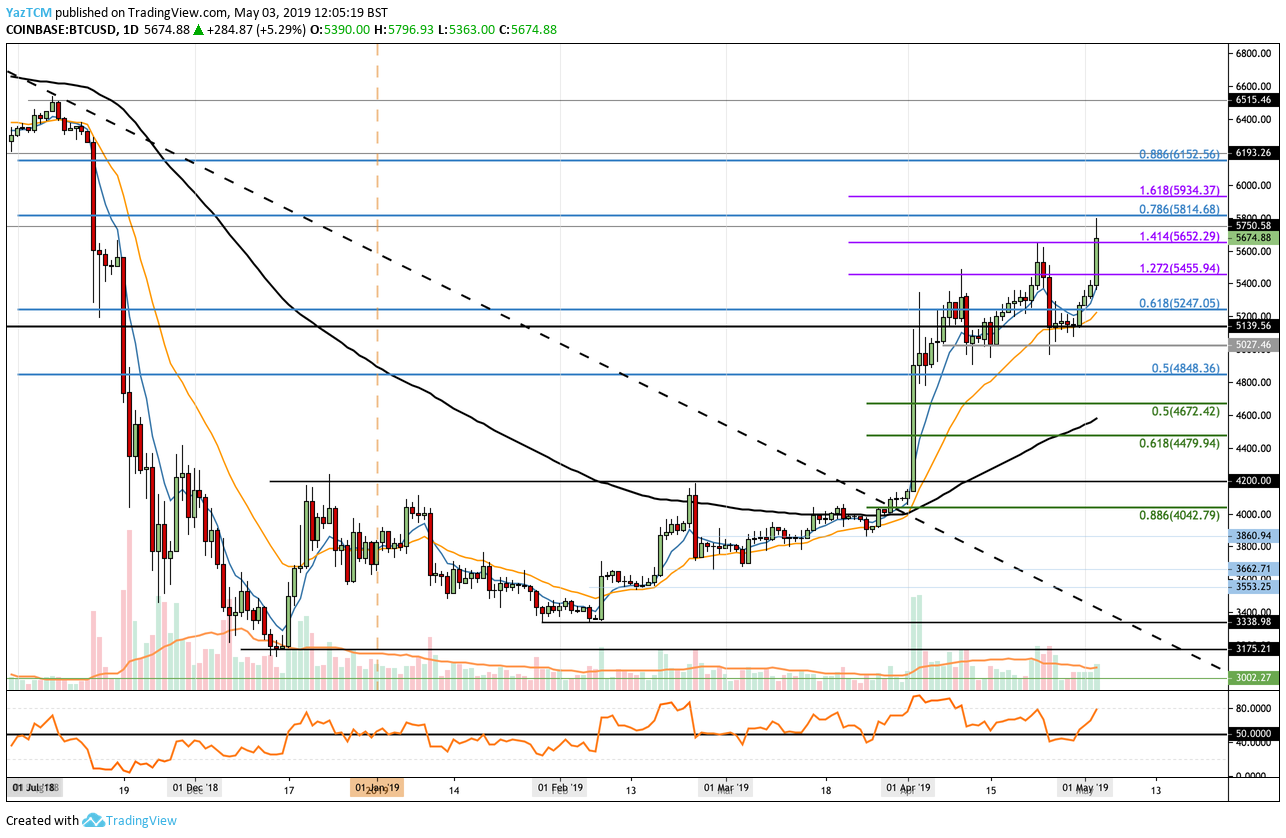
Bitcoin performed very well during April 2019 after the market managed to surge by a total of 22% over the past 30 trading days. Toward the end of April, price action found resistance at the short-term 1.414 Fibonacci Extension level (drawn in purple), priced at $5,652. After reaching this resistance, the market went on to fall into support around the $5,140 level.
The market went on to rebound at this level of support. We can see that Bitcoin has now managed to break above the April 2019 resistance to climb further higher and create a fresh 2019 high around $5,814. Over the past 24 hours, the market has surged by a total of 6%, allowing Bitcoin to climb into higher resistance at $5,814, which contains the long term bearish .786 FIbonacci Retracement level. This bearish Fibonacci Retracement level is measured from the November 2018 high to the December 2018 low.
The market cap for Bitcoin has now broken above $100 billion, to reach $102 billion during the most recent surge.
Bitcoin has since dropped from the resistance at $5,814, and is now trading around support at $5,652. If the buyers can continue to add to the pressure over the next few days and break above the resistance at $5,184, we can expect immediate higher resistance above to be located at the 1.618 Fibonacci Extension level (drawn in purple), priced at $5,934. Above this, higher resistance is then expected at the $6,000 level.
If the bullish pressure continues to push BTC/USD above $6,000, further resistance then lies at the bearish .886 Fibonacci Retracement level (drawn in blue), priced at $6,152. Resistance above this is expected at $6,400 and $6,515.
Alternatively, if the sellers regroup and begin to push the market lower, we can expect immediate support below at $5,600, $5,455, $5,247, $5,139, and $5,000.
The recently reached fresh 2019 high for Bitcoin allows the market to start May 2019 on a bullish note. If the buyers can continue to increase the pressure, we can expect Bitcoin to break cleanly above the $6,000 level in the coming days. If the buyers can continue above strong resistance at $6,152 and continue above $6,350, the trading condition will be considered bullish and Bitcoin may be able to travel higher and clear the November 2018 highs.
Ethereum
ETH/USD – MEDIUM TERM – DAILY CHART
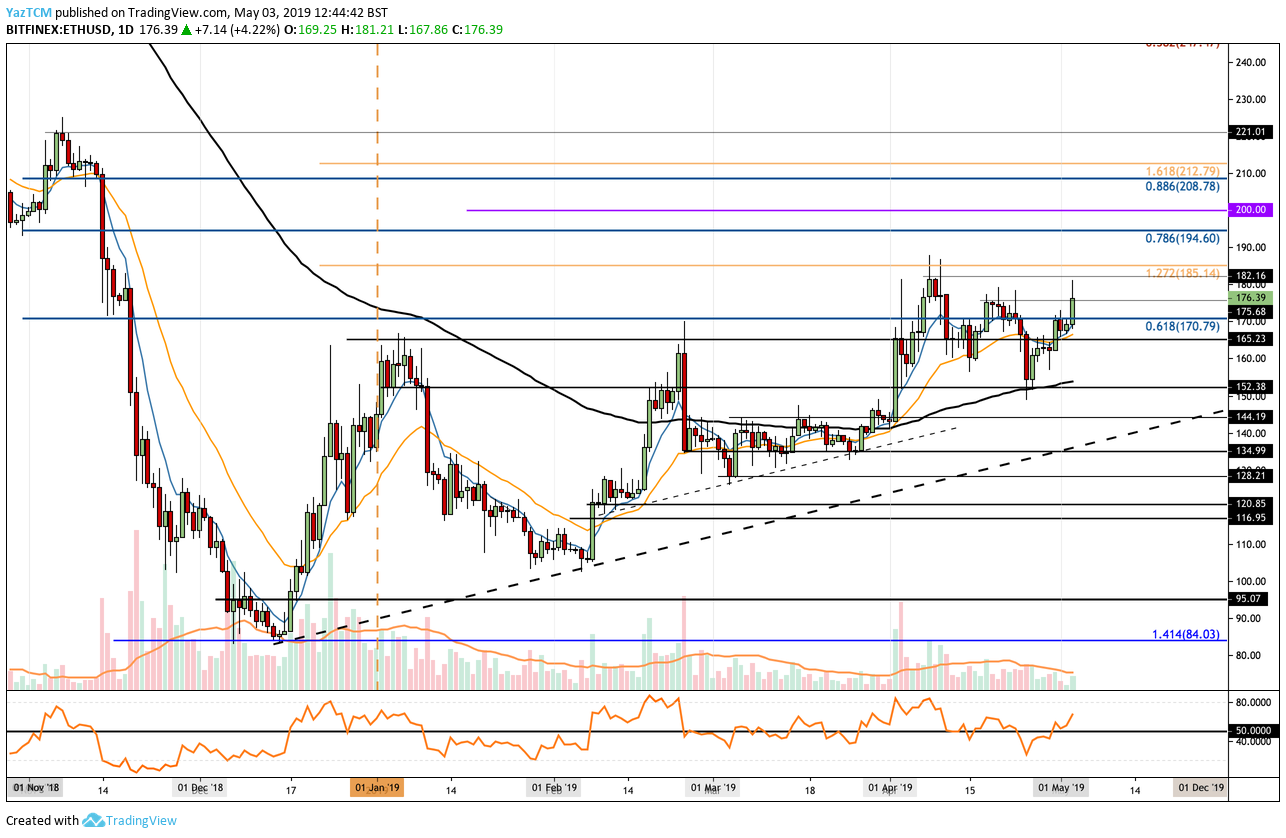
Ethereum has also had a decent month during April 2019, as the cryptocurrency was able to reach a high of around $185. The cryptocurrency also managed to remain above the 100-day moving average for the entire month. ETH/USD rebounded at the 100-day moving average support level toward the end of April 2019, and recently managed to break back above the $175 resistance level.
Ethereum, ranked in the 2nd position, currently holds a $17.88 billion market cap value, up around $700 million in April 2019.
If the bulls continue to cause ETH/USD to drive further higher, we can expect immediate resistance above to be located at $180 and at $185, which contains the medium-termed 1.272 Fibonacci Extension level (drawn in yellow). If the bulls are successful in overcoming the resistance at $185, higher resistance is then located at the bearish .786 FIbonacci Retracement level (drawn in blue), priced at $194.60. This bearish Fibonacci Retracement level is also measured from the November 2018 high to the December 2018 low. Resistance above $194 is then expected at $200.
If the buyers can continue to travel further above $200, more resistance is to be expected at the bearish .886 Fibonacci Retracement level (drawn in blue), priced at $208.
The RSI has recently managed to break back above the 50 level, which indicates that the bulls have now retaken possession of the market momentum.
If the sellers start to push prices lower for ETH/USD, we can expect support below to be located at $170, $165, $152, and $144.
Ethereum performed well in April 2019 and has started May 2019 strongly. Key resistance above for Ethereum will be located at $185, a level which stalled ETH/USD during April. If the bulls break above $185, they will be free to take a shot at the $200 level.
Ripple
XRP/USD – MEDIUM TERM – DAILY CHART
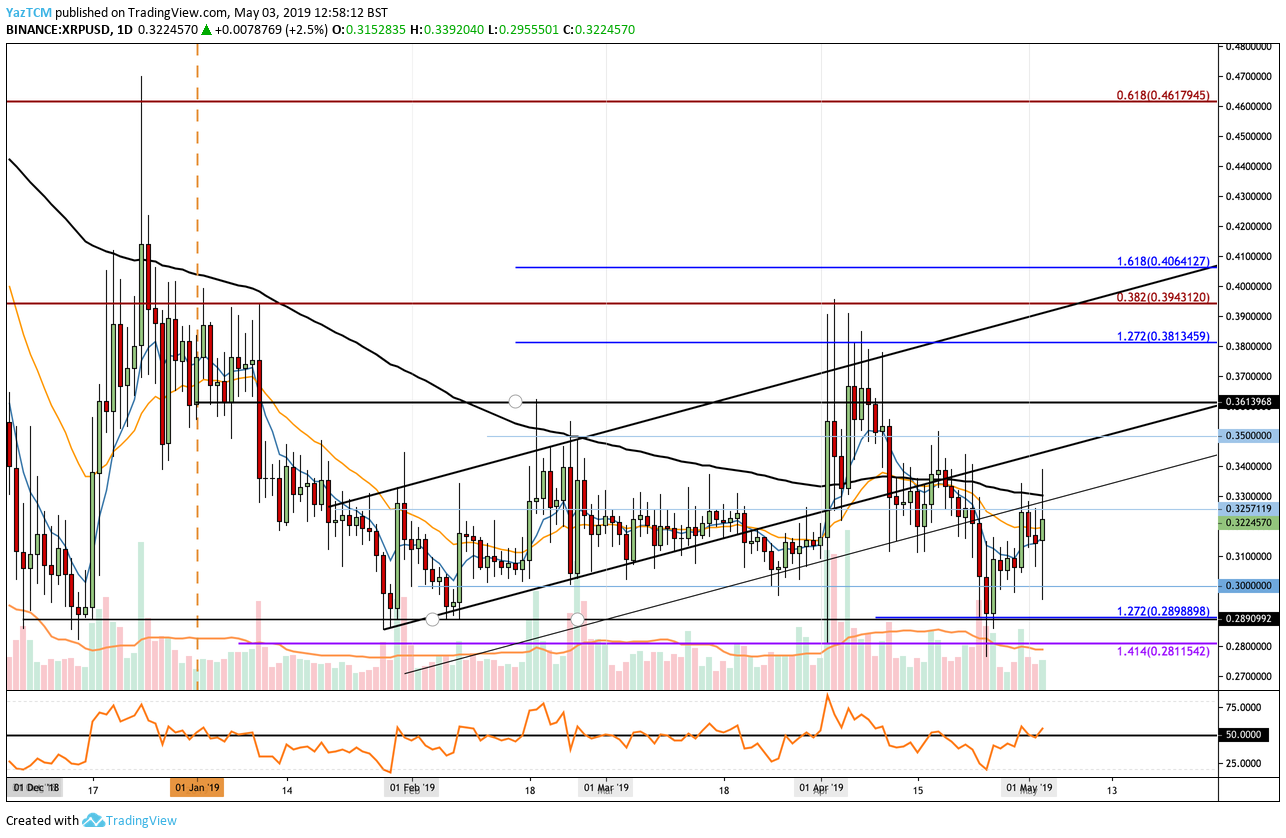
Ripple continues to be one of the weakest performers out of the top projects throughout April 2019. The cryptocurrency lost a total of 10% over the past 30 trading days alone. In fact, during April 2019, Ripple lost 30% from high to low. However, the market was able to find strong support at the $0.2890 level, a level that provided significant support for the market during December 2018 and January 2019.
Ripple has now rebounded from this support, and has managed to break back above the $0.32 level.
Ripple is currently ranked in 3rd position with a total market cap value of $13.05 billion, down $440 million in April 2019.
Despite the recent sluggish price movements for Ripple, the RSI has recently been able to break above the 50 level recently, which indicates that the bulls have retaken control of the market momentum. If the bullish pressure increases and pushes Ripple higher, we can expect immediate strong resistance above to be located at the 100-day moving average level, which currently hovers around $0.33.
If the buyers can break above $0.33, higher resistance is then to be expected at $0.35, $0.3613, $0.37, $0.27, and at $0.3943 which contains the bearish .382 Fibonacci Retracement level.
Alternatively, if the sellers continue to bring price action lower for Ripple, we can expect immediate support below at $0.31, $0.30, $0.2898, and $0.2811.
Ripple continues to increase its price at the same pace as its close rivals are able to do so. However, if Ripple can break back above the 100-day moving average at $0.33, we can expect the market to start to try and reclaim some of the gains that it has recently been missing out on.
Litecoin
LTC/USD – MEDIUM TERM – DAILY CHART
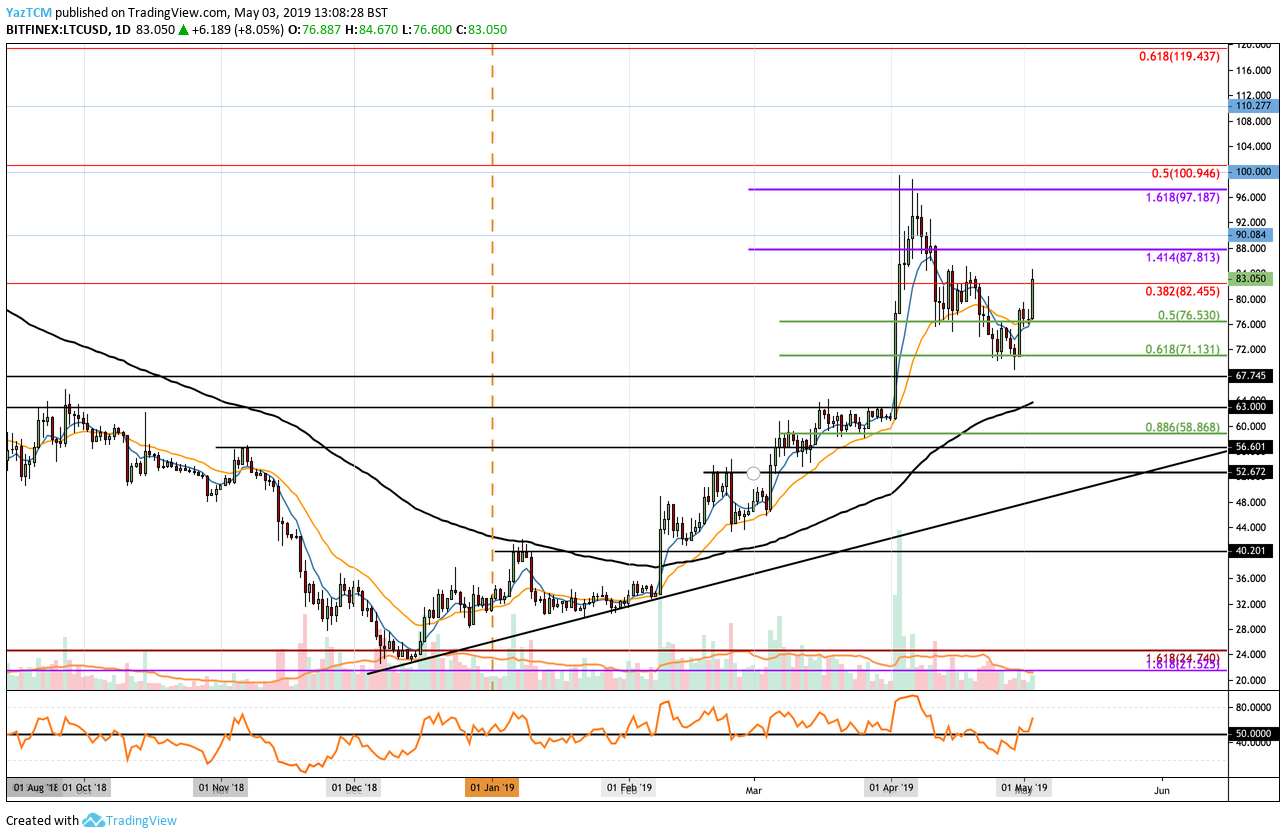
Litecoin didn’t have the best month during April 2019, after the cryptocurrency dropped a total of 14% from high to low during the month. However, this does not take away from the fact that Litecoin has still seen an epic return over the past 90 trading days, which totals over 138%, making it one of the strongest performers in the top 20 projects in 2019.
In April 2019, we can see that LTC/USD fell into support at the short term .618 Fibonacci Retracement level, priced at $71.13. The cryptocurrency has since rebounded from this level, and is now trading higher at the $83 level.
Litecoin is now ranked in 5th position in the market cap rankings, as it holds a $4.90 billion market cap value.
The recent price jump higher has also now allowed the RSI to break above the 50 level once again as the bulls take charge of the momentum. If the bulls can break above the current resistance at the bearish .382 Fibonacci Retracement level, priced around $82.45, we can expect higher resistance to be located at $87.81 and $90. Above $90, more resistance is to then be expected at the bearish .5 Fibonacci Retracement level (drawn in red), priced at $100.
If the bullish pressure allows LTC/USD to continue above $100, more resistance above can be expected at $110 and $119.
Alternatively, if the sellers begin to push the market lower again, we can expect immediate support below the market to be located at $80, $76.53, $71.13, and $63.
Litecoin has not had the strongest month of performance during April. However, the crypto is up by 138% over the past 3 months regardless. If the bullish pressure continues, we can expect Litecoin to break above the $100 resistance level and continue higher at some point during May.
Bitcoin Cash
BCH/USD – MEDIUM TERM – DAILY CHART
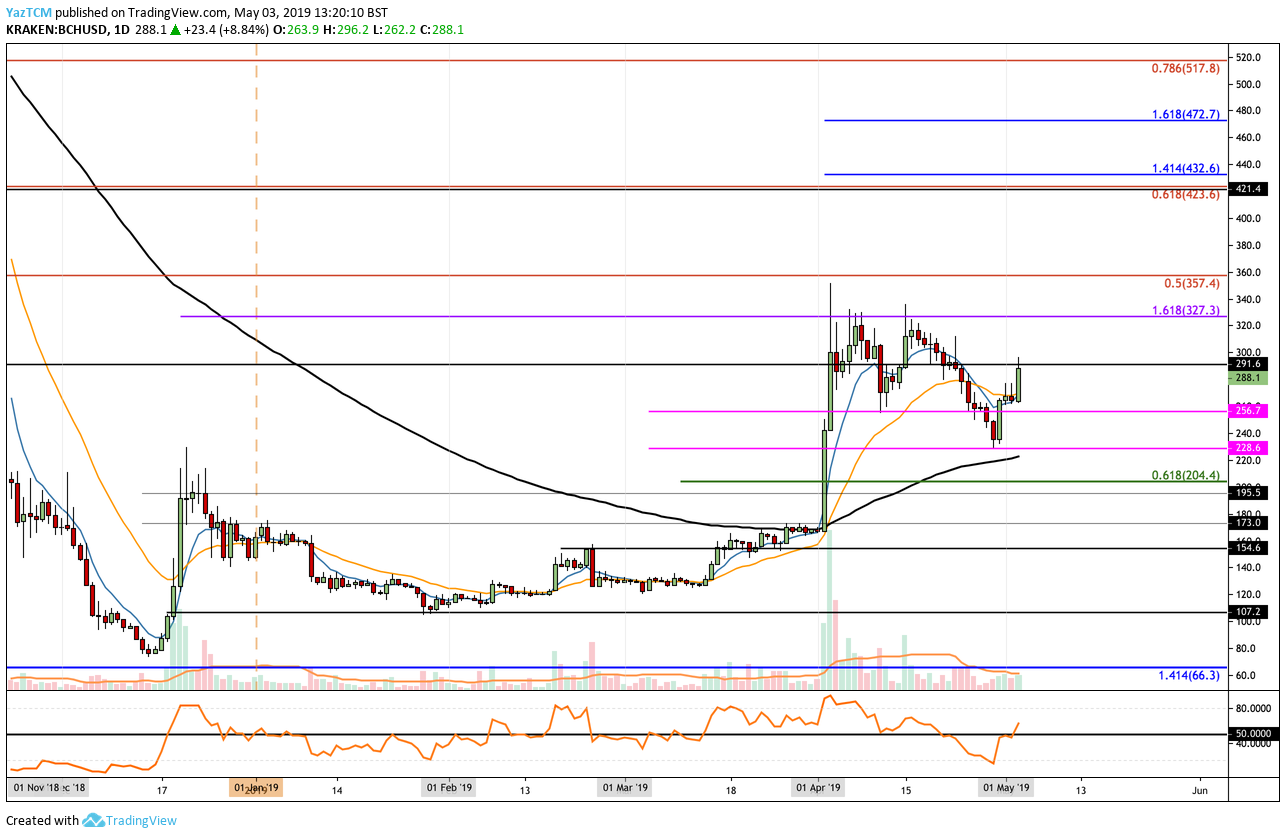
Bitcoin Cash did not perform too badly during April 2019. The market managed to surge higher into resistance around the $327 level, provided by a 1.618 Fibonacci Extension level. BCH/USD was unable to break above this level of resistance, and price action rolled over and fell into support around $228.
We can see that Bitcoin Cash has now managed to rebound at this support level, and is now trading higher at resistance around $290.
Bitcoin Cash is now ranked in the 4th position, as it currently holds a $5.20 billion market cap valuation.
If the bulls can continue to climb higher above the current resistance around $290, we can expect immediate higher resistance at the $300 level. Above this, significant resistance is then located at the $327 level. BCH was unable to break above this level during April, so it will require significant momentum to overcome.
Above $327, more resistance can then be located at $357, $370, $400, and $423.
If the sellers do begin to push BCH/USD lower, we can expect support to be located at $256, $228, $204, and $195.
Bitcoin Cash has seen an impressive 144% price increase over the past 90 days. During May, if Bitcoin Cash can climb above the significant resistance at $327, the coin may be able to travel higher and test the $400 level.
EOS
EOS/USD – MEDIUM TERM – DAILY CHART
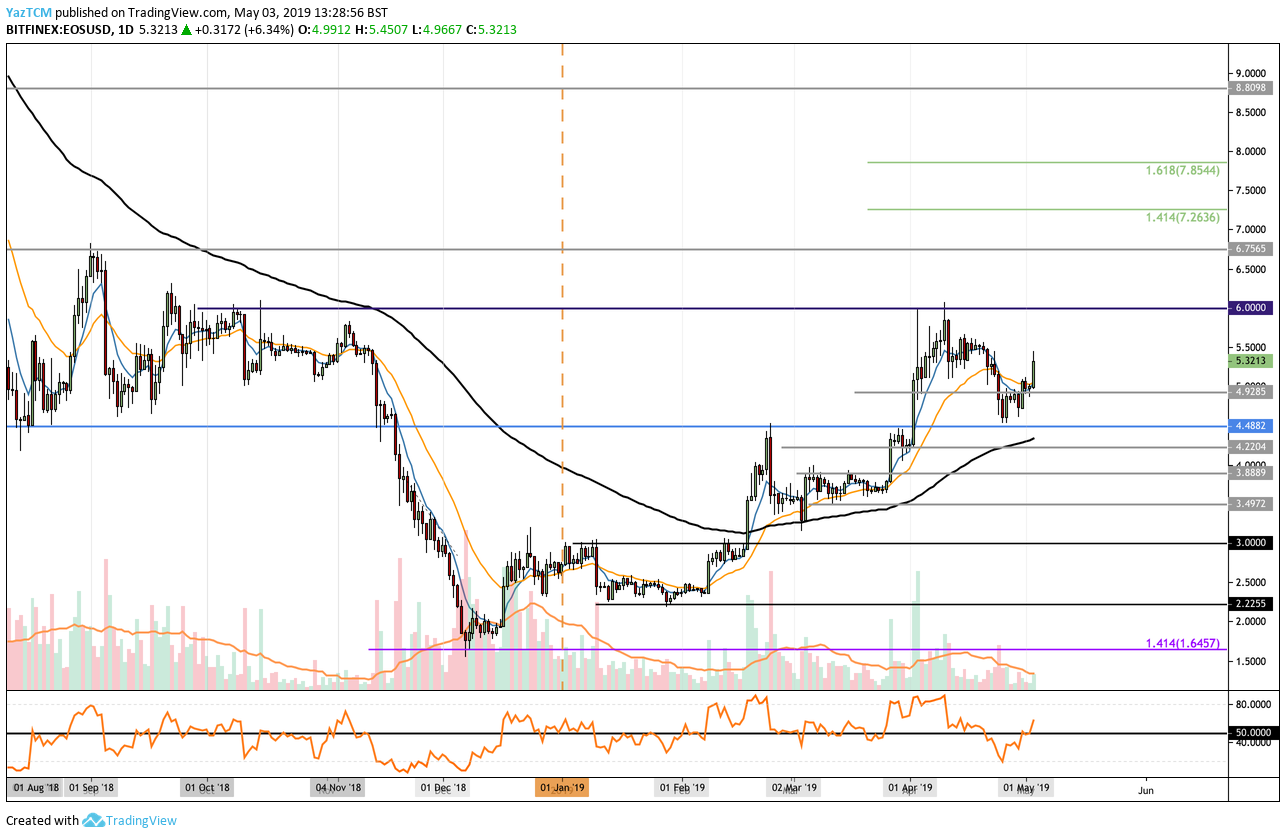
EOS managed to reach a high of $6.00 during April 2019. After reaching this high, the market went on to fall into support around $4.50, where a rebound was experienced. EOS is now trading at a price of around $5.32 after seeing a 7.22% price increase over the past 24 hours of trading.
EOS is now ranked in 6th position, as it presently holds a $4.80 billion market cap value.
The recent price increase has allowed the RSI to rise and break back above the 50 level, which indicates that the bulls are back in charge of the market momentum for EOS. If the bulls can continue to climb higher, we can expect immediate resistance above to be located at $5.50 and $6.00. The resistance at $6.00 is significant, as it is also the October 2018 high.
Above $6.00, more resistance is then located at $6.50, $6.75, $7.00, $7.26, and $7.85.
Alternatively, if the sellers step back in and push the market lower, we can expect support at $5.00, $4.92, $4.48, $4.22, $4.00, and $3.88.
EOS has seen some magnificent gains over the past 90 days which total 113%. If the bulls would like to continue higher during May 2019, they will need to overcome significant resistance at the $6.00 level.
Binance Coin
BNB/USD – MEDIUM TERM – DAILY CHART
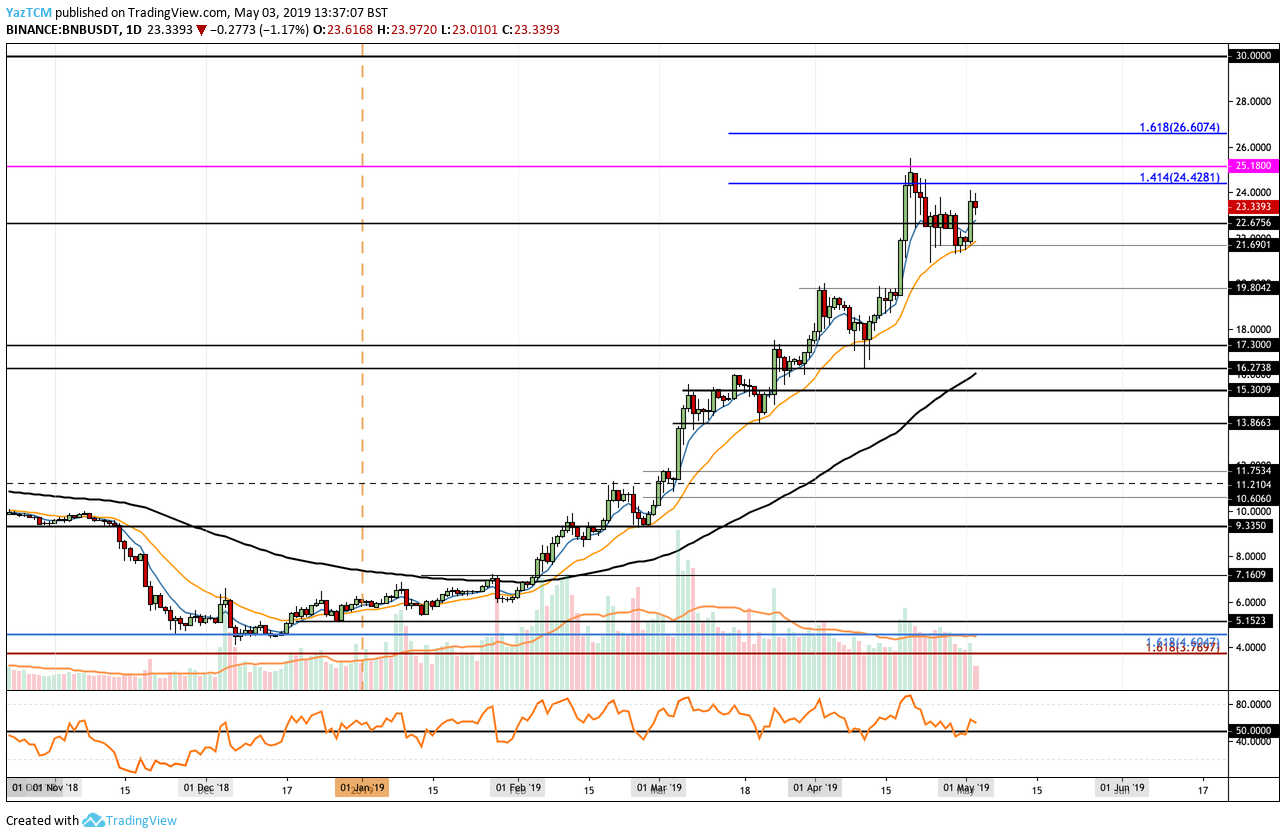
Binance Coin saw a very strong bullish run during April 2019 after the market increased by 21.55% over the past 30 trading days. Binance Coin had also managed to spike up above the previous all-time high price, during April, at $25.18, making it the first cryptocurrency to break above its previous ATH.
Binance Coin fell into support around $21.70 toward the end of April, but the market has now rebounded higher toward $23.33.
Binance Coin is now ranked in 7th position as it presently holds a $3.22 market cap valuation. Furthermore, BNB has seen a gigantic 248% price increase over the past 90 trading days.
If the bulls continue to climb higher for BNB/USD, we can expect immediate resistance above the market to be located at $24.42 and then at the previous ATH at $25.18. If the buyers continue to press BNB/USD further higher, more resistance is then located at $26.60, $28, $29, and $30.
Binance Coin has continued to pursue its epic bull run after surging by 248% over the past 3 months. In May, if BNB can break back above the previous ATH at $25.18, Binance Coin may be able to continue to create fresh ATH toward $30.
Stellar
XLM/USD – MEDIUM TERM – DAILY CHART
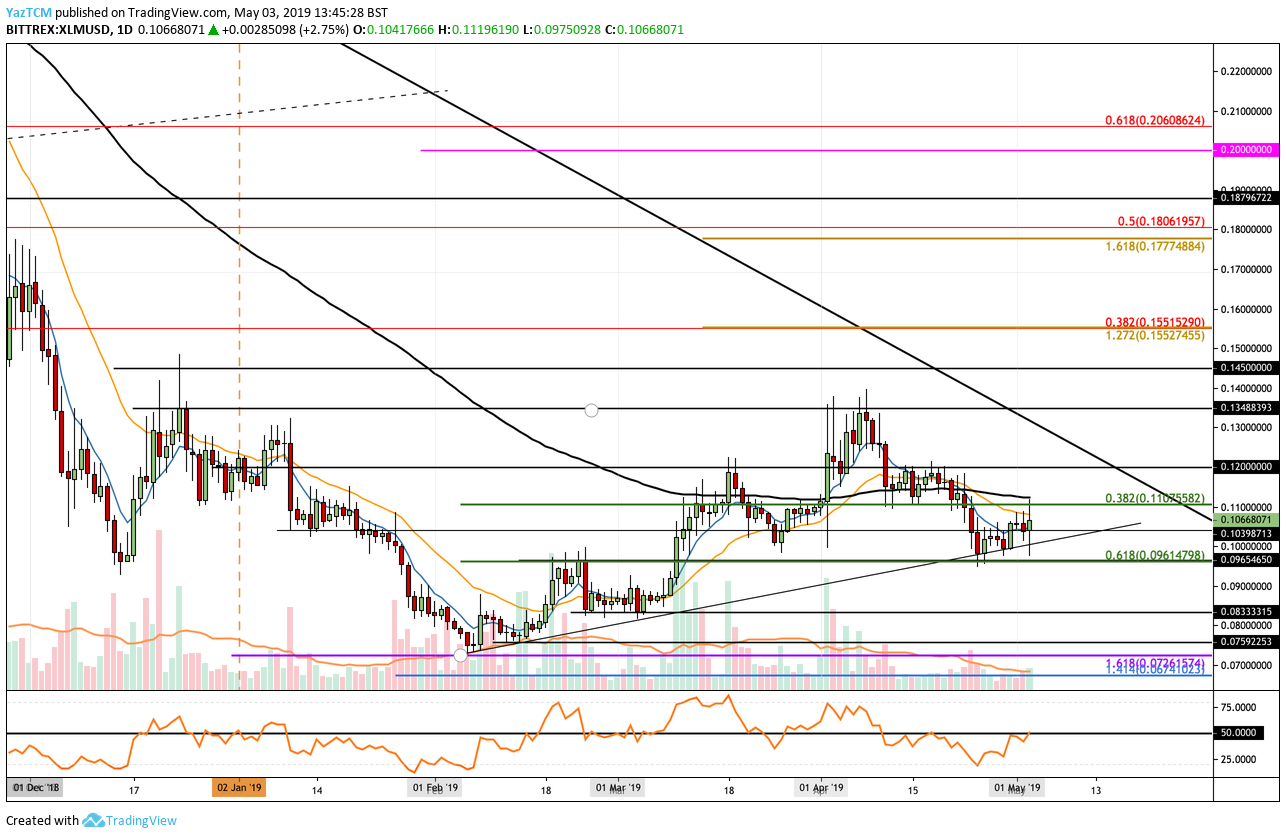
Stellar also struggled during April 2019 after creating a fresh 2019 high above $0.14, the market rolled over and fell into support at the short-term .618 Fibonacci Retracement level priced at $0.096. The coin dropped below the 100-day moving average during April 2019, but it managed to find support at a 3-month-old rising support trend line.
Stellar is now ranked in 9th position, as it presently holds a $1.96 billion market cap valuation.
The recent bull run has now caused the RSI to return to the 50 level. If the RSI can break above the 50 level, we can expect the bulls to resume control of the market momentum. If this is the case, we can expect immediate resistance above the market to be located at the 100-day moving average around the $0.11 level.
Resistance above $0.11 is then located at $0.12 and $0.1348. If the buyers continue above $0.1348, we can expect higher resistance to be located at $0.1450 and $0.1552.
Alternatively, if the sellers continue to push XLM/USD lower, we can expect immediate support below to be located at $0.10, $0.096, $0.090, and $0.083
Stellar is now in a tricky position after falling back toward the $0.1 level. If the RSI can break back above 50, we can expect XLM/USD to make another run higher toward $0.1348. If they can break above $0.1350, XLM/USD will be open to creating more fresh highs for 2019.
Cardano
ADA/USD – MEDIUM TERM – DAILY CHART
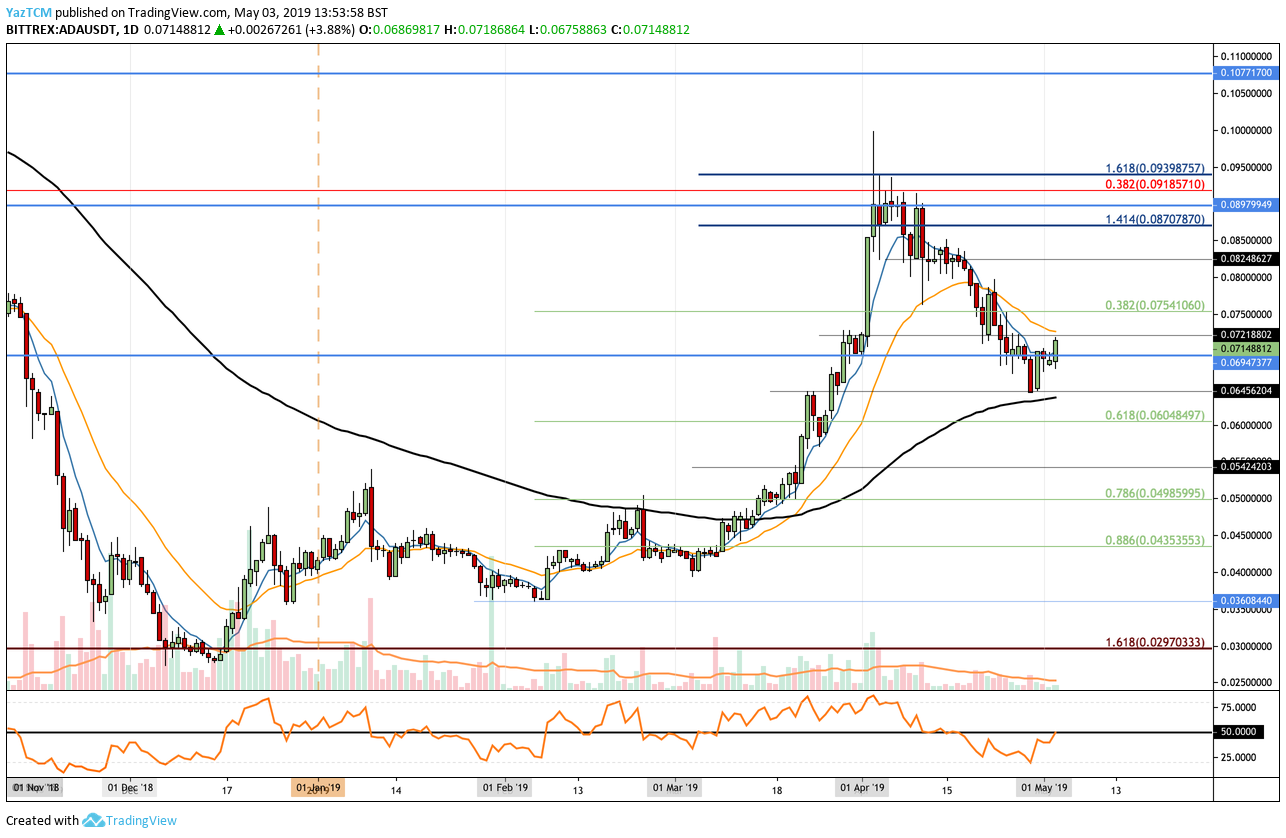
Cardano is also another coin that seriously struggled during April 2018, dropping almost 27% over the past 30 trading days. Cardano managed to create a fresh 2019 high above $0.1, but the market then went on to fall significantly lower. We can see that the market fell into support at $0.0645 before rebounding again.
Cardano is now ranked in 10th position, as it presently holds a $1.86 billion market cap.
The RSI recently returned to the 50 level, which indicates indecision within the market. However, if the bulls can continue to add pressure and push the RSI back above the 50 level, we can expect ADA/USD to begin to travel further higher once again. Initial resistance above the market is to be expected at the $0.075 level. Above this, more resistance can then be found at $0.080, $0.082, $0.087, and $0.091.
Alternatively, if the sellers regroup and push the market lower, initial support is located at $0.069, $0.065, and $0.060.
Cardano has seen a noteworthy price drop over the past 30 days, which totals 27%. However, the coin is still up by 85% over the past 3 months. If Cardano can continue higher and break above $0.075, we can expect the market to be free and open to making an attempt at the April 2019 high around $0.093 again.
Tron
TRX/USD – MEDIUM TERM – DAILY CHART
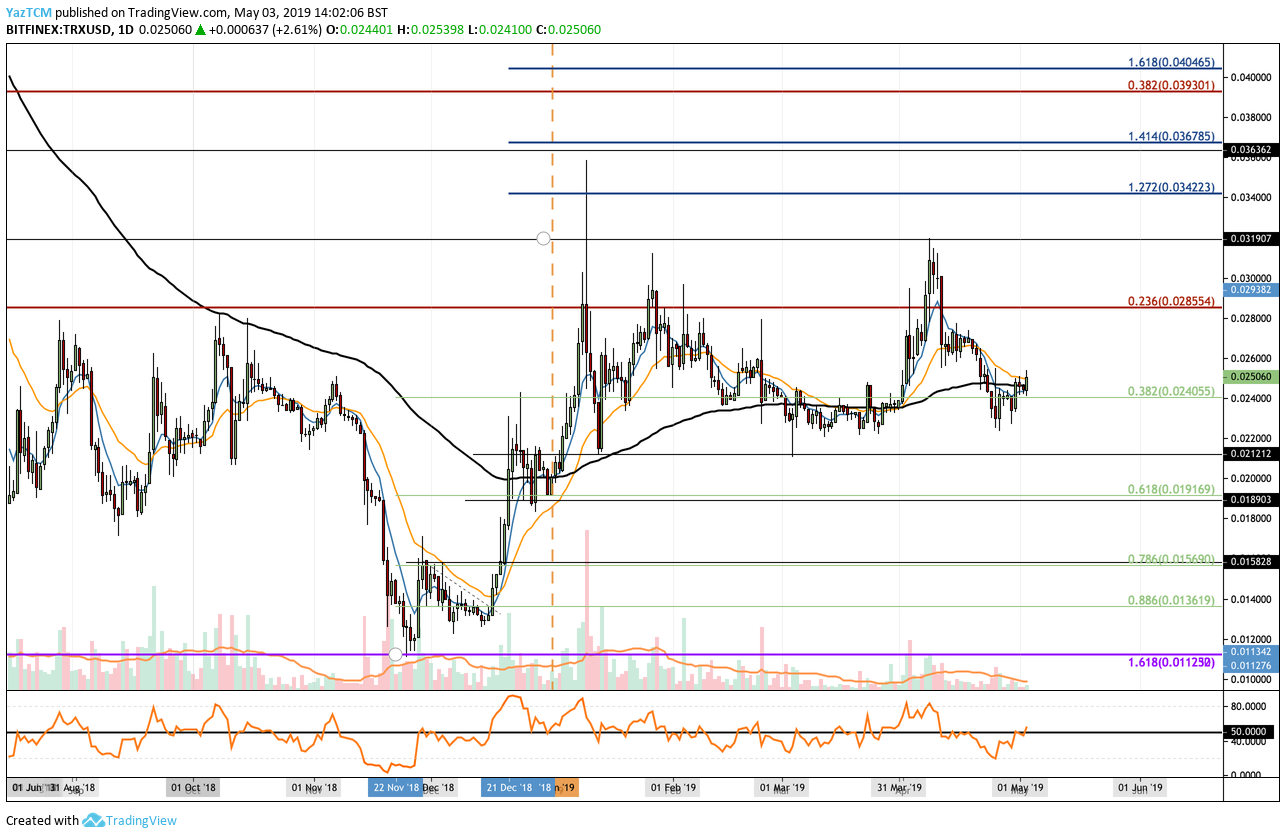
Tron is pretty much the weakest-performing coin on this list over the past 90 days, after the coin has managed to drop by a total of 7%. Tron is currently trading at a price around $0.025 after the cryptocurrency dropped into the support of the 100-day moving average during April 2019.
Tron is now ranked in the 11th position, as it presently holds a $1.62 billion market cap valuation.
If Tron can continue to climb higher, we can expect immediate support above the market to be located at $ 0.026, $0.027, and $0.028. Above this, more resistance can then be expected at $0.030 and $0.0319.
If the buyers can continue to drive TRX/USD further higher, more resistance above is located at the 1.272 and 1.414 Fibonacci Extension levels (drawn in blue), priced at $0.0342 and $0.0367.
Tron continues to be the worst performer over the past 3 months after dropping 7%. The market is in a state of indeicsion at this moment in time and will require a break above $0.03 to turn bullish again. If Tron drops beneath $0.022 then the coin may slip further lower during May.