
The recent price surge in Bitcoin (BTC) has caused the rest of the industry to boom simultaneously. Since the start of April 2019, the total market cap of the entire cryptocurrency industry has increased by a total of $41 billion to reach a high of $184 billion. The entire market cap has since fallen slightly and now rests at $170 billion.
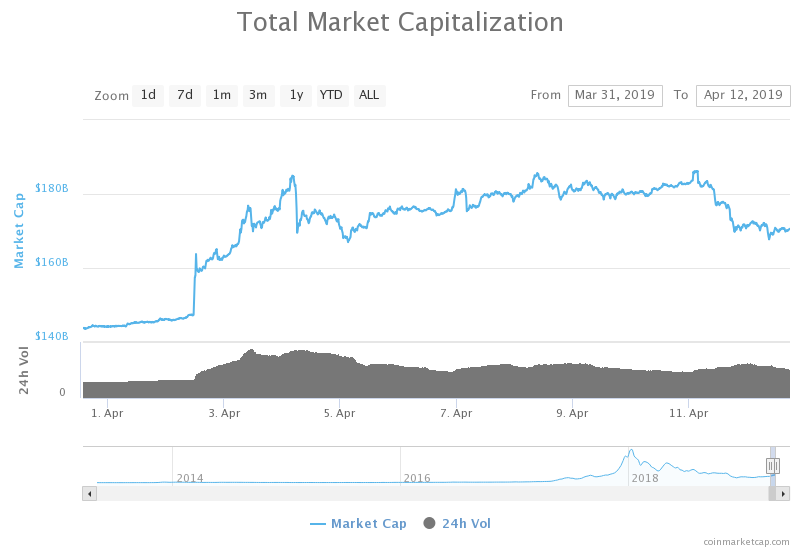
With the recent price rises, many are believing that this marks the start of a fresh bull run, and they may very well be correct. There have been a number of signals that could indicate that the bear market has run its course, which include breaks above long-term descending trend lines and cryptocurrencies rising above their 100-day moving average.
Despite this, many analysts agree that Bitcoin cannot be considered bullish until price action rises 2 times from its bottom. In the case of Bitcoin, the bottom is around $3,175, which means that until BTC breaks above $6,350 it is not considered a bull run. However, this still can mean that the bearish run is over and the current market condition is presently neutral until a break above $6,350.
Bitcoin
BTC/USD – MEDIUM TERM – DAILY CHART
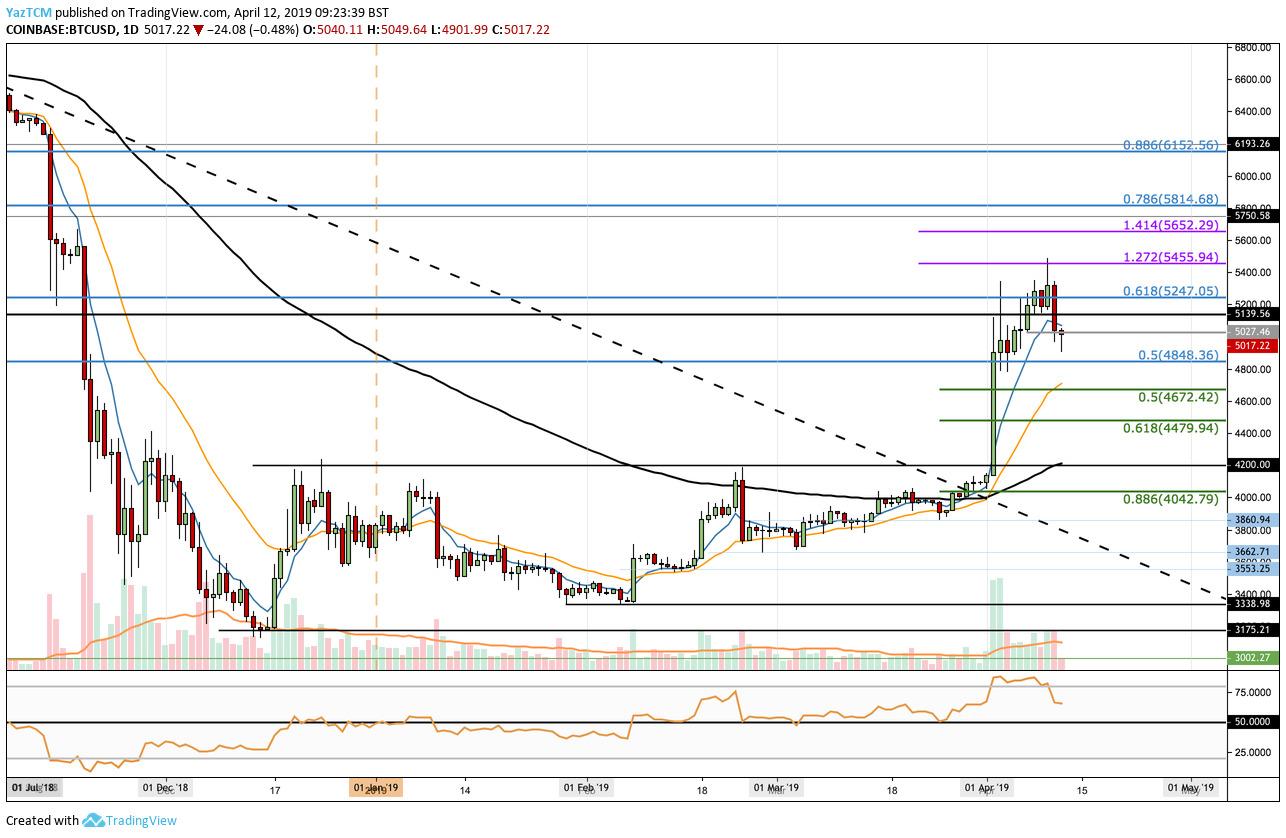
Bitcoin started the month of April off on a very strong footing after the cryptocurrency surged from $4,000 by a total of 36% to the April 10, 2019 high of $5,488. The market had started the month off by climbing above an 11-month-old descending trend line, creating the first signal that a significant run was on the cards. The second signal came after BTC/USD managed to climb above the 100-day moving average. After this, the market surged higher.
Price action has recently risen into resistance at the bearish .618 Fibonacci Retracement level (drawn in blue) priced at $5,247. This bearish FIbonacci Retracement level is measured from the November 2018 high to the December 2018 low. The market managed to spike slightly higher into resistance above $5,400, but was unable to hold at this level.
Bitcoin now currently holds a market cap value of $88.64 billion after the recent price surge.
In the most recent trading sessions, Bitcoin has rolled over and fallen into support at the $5,000 level. The recent price drop has allowed the RSI to turn away from overbought conditions into comfortable bullish territory above 50. If the sellers push the market beneath $5,000, further support is then located at $4,848, the long-term bearish .5 Fibonacci Retracement level (drawn in blue). Beneath $4,848, support then lies at the short-term .5 and .618 Fibonacci Retracement levels (drawn in green) priced at $4,672 and $4,479, respectively.
Alternatively, if the bulls can defend the $5,000 level and resume the previous bullish run higher, initial resistance above is expected at the $5,247 level. Above $5,427, higher resistance can then be expected at the short-term 1.272 and 1.414 Fibonacci Extension levels (drawn in purple) priced at $5,455 and $5,652, respectively. Above this, further resistance is expected at the long-term bearish .786 and .886 Fibonacci Retracement levels (drawn in blue) priced at $5,814 and $6,152, respectively.
This recent pullback is necessary for Bitcoin to continue to rise higher, as the market had been oversold. If the bulls can hold $5,000, we can expect the market to continue to climb higher toward the $6,000 level.
Ethereum
ETH/USD – MEDIUM TERM – DAILY CHART
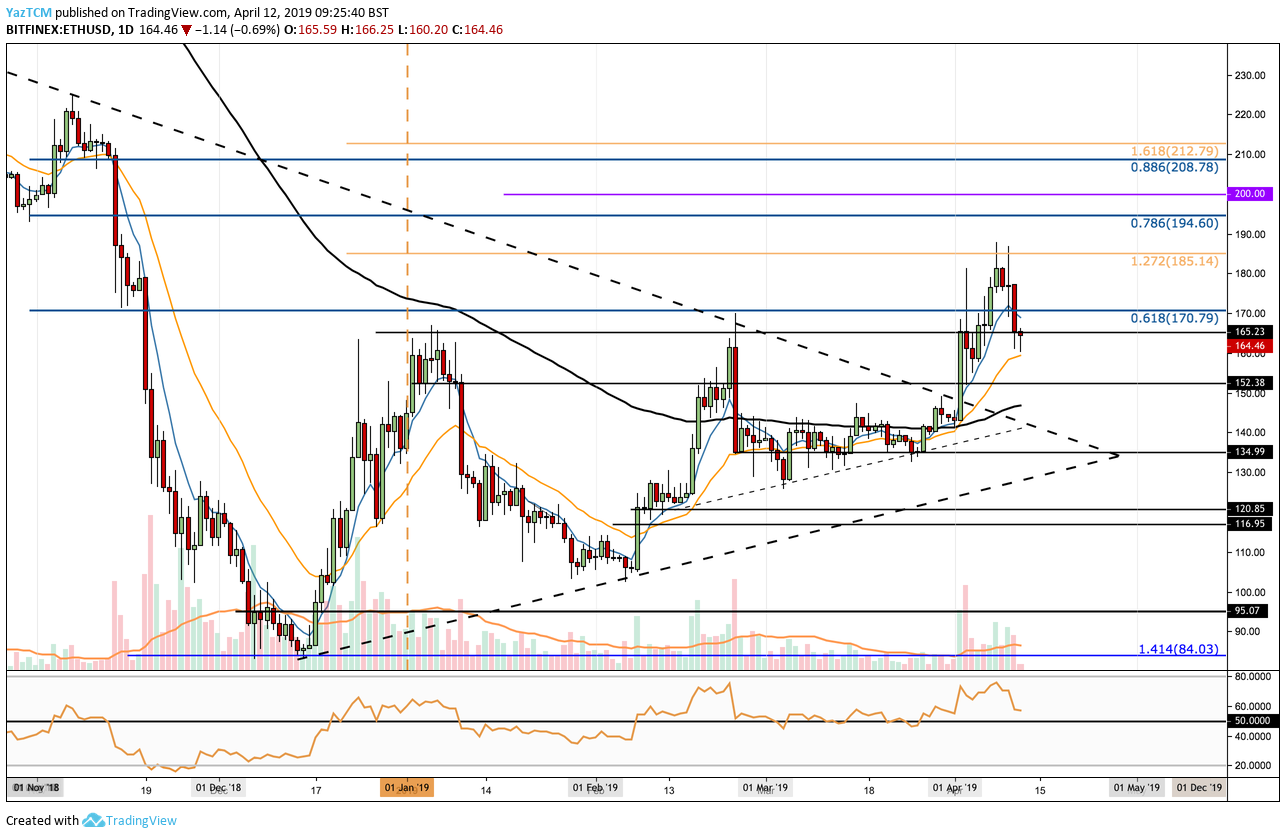
Ethereum (ETH) also started April 2019 off on a strong stance, after the market managed to climb above the 100-day moving average and break above a long-term descending symmetrical triangle.
After breaking above the triangle, Ethereum continued to rise into resistance at a medium-termed 1.272 Fibonacci Extension level (drawn in orange) priced at $185.14 before stalling and reversing. Ethereum has fallen slightly and now sits at support around the $165 level.
Ethereum, ranked in the 2nd position, currently holds a $17.14 billion market cap value.
If the sellers continue to push the market lower, initial support is expected at $152 and $150. Beneath $150, support is then expected at $140, $134, and $120.
The RSI had not reached extreme overbought conditions, unlike Bitcoin. However, the recent price drop has caused the RSI to fall lower. If it can remain above 50 over the following week, we can expect the bullish run to continue higher.
When the bulls regroup and begin to push the market higher, initial resistance above is expected at $170 and $185. Above $185, further resistance is located at the bearish .786 Fibonacci Retracement level (drawn in blue) priced at $194. This is then followed with resistance at $200. Above $200, further resistance is located at the bearish .886 Fibonacci Retracement level priced at $208.
After breaking above the long-term symmetrical triangle, Ethereum ran into resistance at $185. If the buyers can hold support at $150, we can expect the bull run to resume and head toward the $200 level.
Ripple
XRP/USD – MEDIUM TERM – DAILY CHART
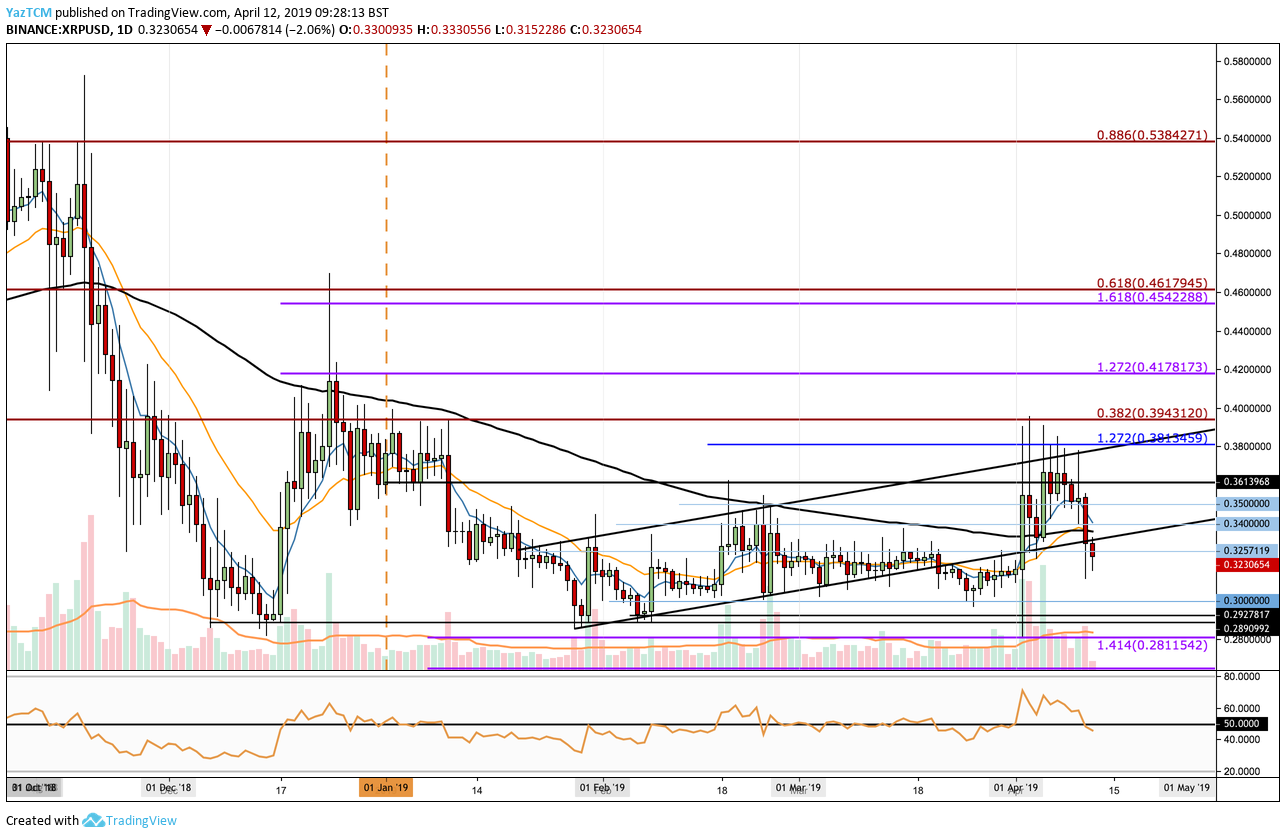
Converse to the majority of cryptocurrencies, Ripple has not benefited greatly from the recent Bitcoin surge. The market had been trading within an ascending triangle since the start of February 2019. Toward the end of March 2019, XRP fell beneath the price channel for a few days. However, as the Bitcoin bull run began in April, we can see XRP/USD ran back into the price channel and met resistance at the upper boundary.
The market struggled to break above the previous price channel and rolled over. Price action has recently broken back beneath the channel, as it now trades around the $0.32 support level.
Ripple is currently ranked in 3rd position, with a total market cap value of $13.49 billion.
The RSI has recently slipped beneath the 50 level, which indicates that the sellers have gained control of the market momentum. If the sellers continue to push XRP/USD lower, we can expect immediate support to be located at the $0.30 level. Beneath $0.30, further support is located at $0.2927 and $0.2890.
Alternatively, if the bulls can wake up and start to push XRP/USD higher, resistance is initially located at $0.34, $0.35, $0.3620, and the upper boundary of the price channel. Above the channel, resistance is then located at $0.38, and then at the bearish .382 Fibonacci Retracement level priced at $0.3943.
Ripple has been struggling during 2019, unable to make any ground above the $0.40 level. If the bulls can defend the strong support at the $0.30 level, we can expect another run higher. Whether XRP breaks back above $0.40 in the next run is still uncertain.
EOS
EOS/USD – MEDIUM TERM – DAILY CHART
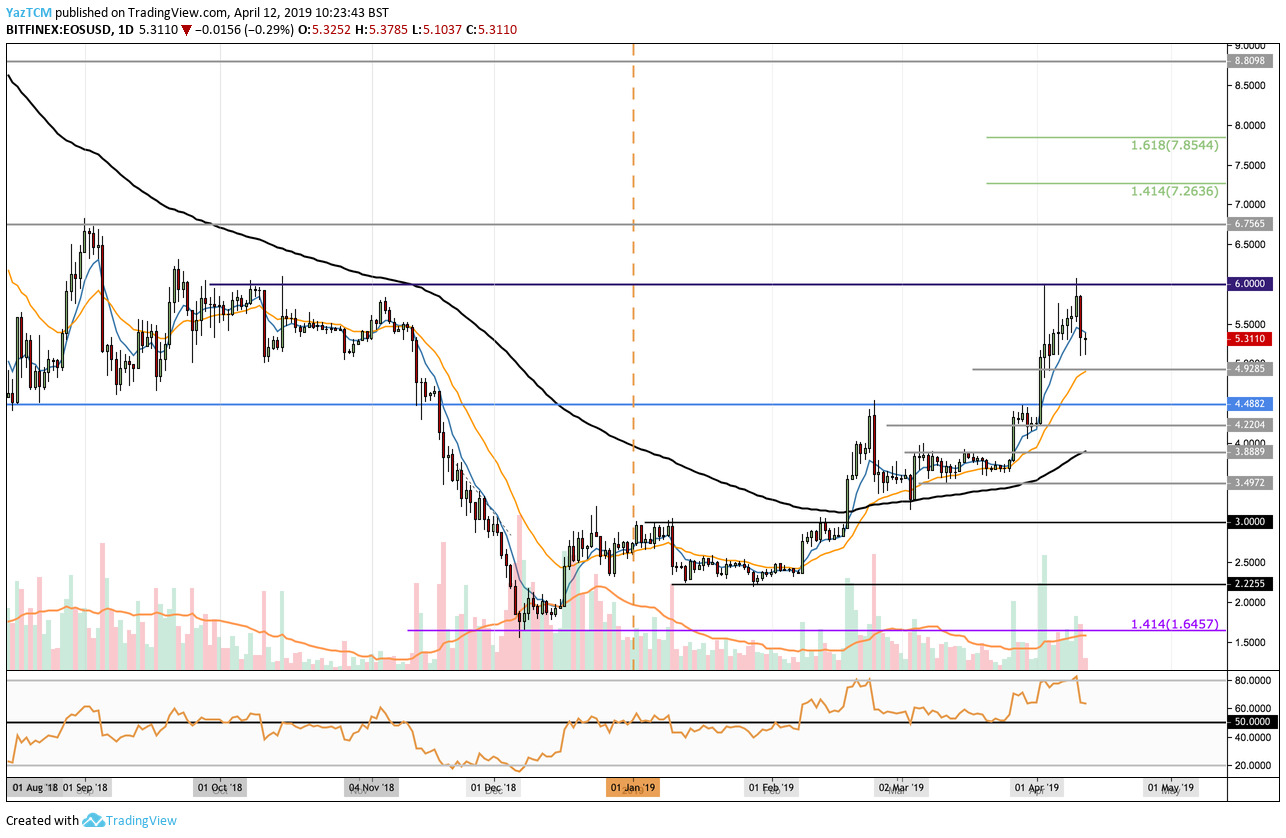
EOS has had a wonderful run so far in 2019 after the market has increased by a total of 120% over the past 90 trading days. The 21-month-old cryptocurrency project has recently managed to run into resistance around the $6.00 level, reaching the high of October 2018.
The RSI for EOS had reached overbought conditions which had caused EOS to drop slightly over the past couple of days into the current $5.31 level. EOS is ranked in 4th position as it presently holds a $4.80 billion market cap value.
If the sellers continue to drive EOS/USD lower, initial support is expected at $4.92 and $4.48. Beneath $4.48, more support is then located at $4.22, $3.88 and $3.49.
Alternatively, if the bulls resume their recent climb higher, we can expect initial resistance above to be located at $6.00 again. Above $6.00, more resistance is then located at $6.76. This is then followed with more resistance at the short term 1.414 and 1.618 Fibonacci Extension levels priced at $7.26 and $7.85, respectively.
EOS has had a remarkable 120% price increase over the past 90 days and has just run into resistance at $6.00. If the bulls can hold support at $4.48, we can expect $6.00 to be broken on the next rise.
Litecoin
LTC/USD – MEDIUM TERM – DAILY CHART
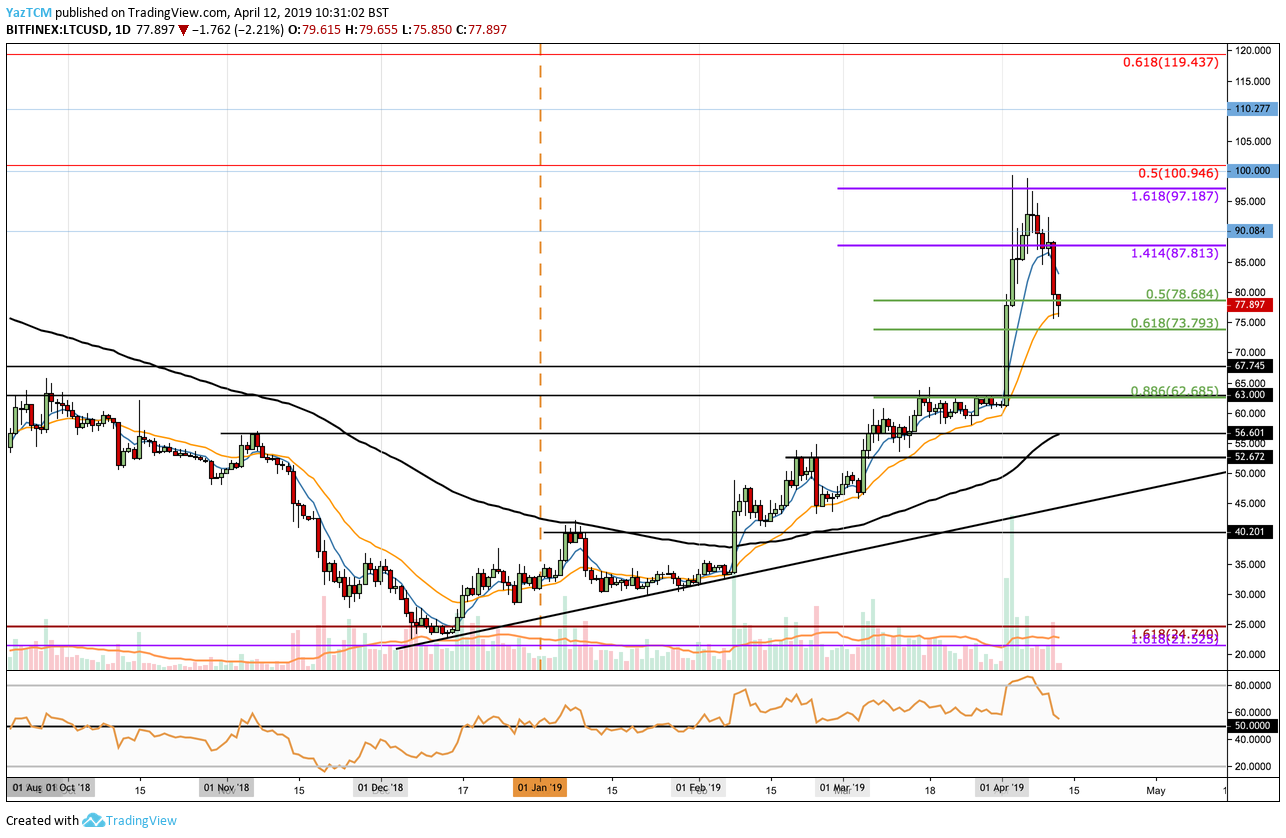
Much like EOS, Litecoin has also enjoyed a magnificent run during 2019 after rising by a total of 134% over the past 90 trading days. Litecoin had broken above the 100 day moving average during February 2019 and has continued to increase ever since.
The market had recently run into resistance at a 1.618 Fibonacci Extension level (drawn in purple) priced at $97.18. Price action had made an attempt higher but was unable to hold above and proceeded to roll over and fall. The RSI was also at overbought conditions at this time which suggested the market needed some room to breathe before climbing higher.
Litecoin has now dropped into support around the short term .5 Fibonacci Retracement level (drawn in green) priced at $78.64. The cryptocurrency is now ranked in 5th position as it presently holds a $4.78 billion market cap value.
If the sellers continue to push the market lower, we can expect immediate support below at the .618 Fibonacci Retracement level (drawn in green) priced at $73.79. Support below this is then located at $67.74, $63 and $56.60.
Alternatively, if the bulls can hold the support at $73.80 and begin to push LTC/USD higher, initial resistance above is expected at $87.81, $90 and at the previous $97.18 resistance. If the buyers can continue to climb above the strong resistance at $100, further resistance can then be located at $110 and $119.
Litecoin has retraced slightly since reaching resistance at $97.18. If the bulls can defend the $73.80 support and If the RSI can remain above 50 we can expect Litecoin to make another attempt at the $100 level.
Bitcoin Cash
BCH/USD – MEDIUM TERM – DAILY CHART
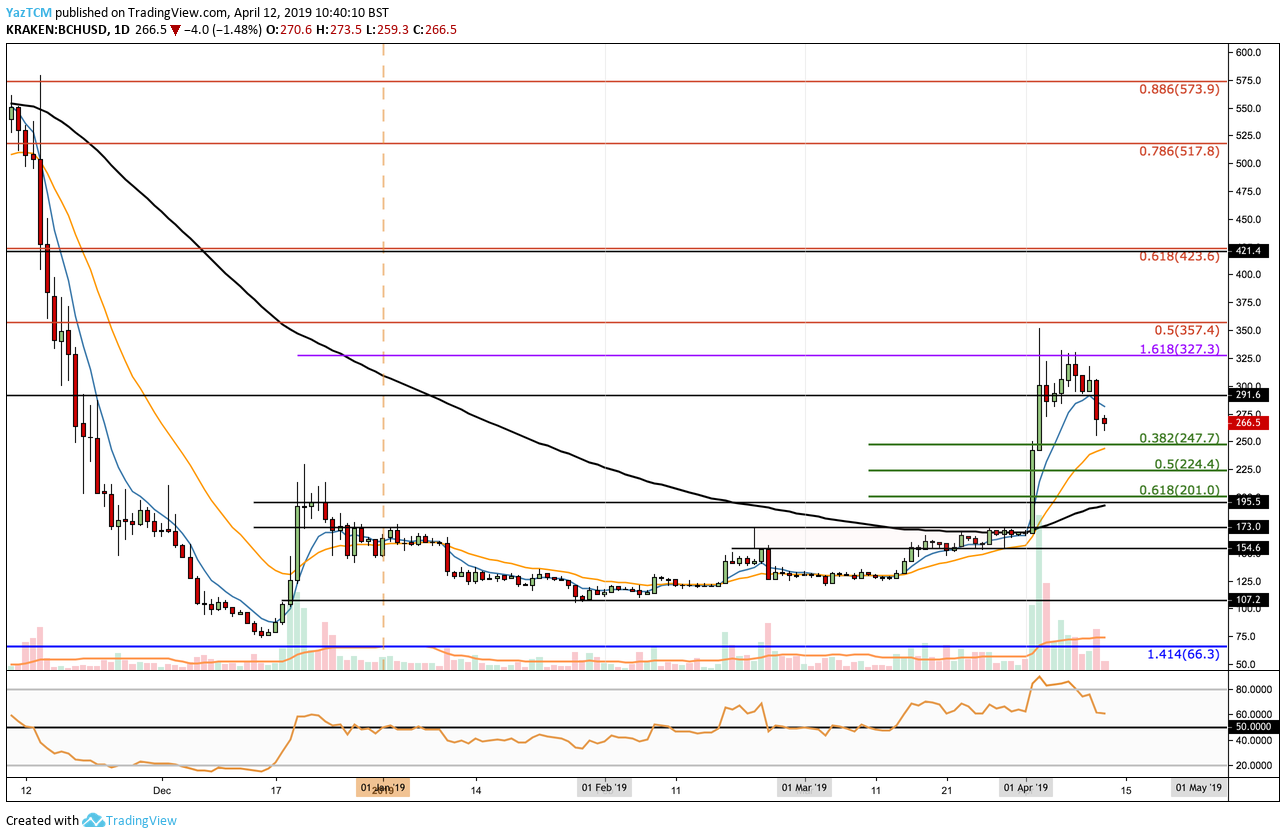
Much to the dismay of the majority of BTC holders in the industry, BCH has also enjoyed a remarkable run after increasing by 106% over the past 30 days. The cryptocurrency had benefited greatly from the BTC price increase and had managed to surge into resistance at a 1.618 FIbonacci Extension level (drawn in purple) priced at $327.
Bitcoin Cash is now ranked in the 6th position as it presently holds a $4.72 billion market cap value. The cryptocurrency has now dropped beneath $300 into support around $265. If the sellers continue to drive the market lower, support is expected at the short term .382 and .5 Fibonacci Retracement levels (drawn in green) priced at $247 and $224, respectively. Support beneath this is then expected at the $200 level.
Alternatively, if the buyers regroup and start another ascension higher, resistance is expected back at the $327 level. Above this, further resistance can then be located at the bearish .5 and .618 Fibonacci Retracement levels (drawn in red) priced at $357 and $423, respectively.
If Bitcoin Cash can hold support around $200, we can expect the bulls to make another climb higher and possibly head above $400.
Binance Coin
BNB/USD – MEDIUM TERM – DAILY CHART
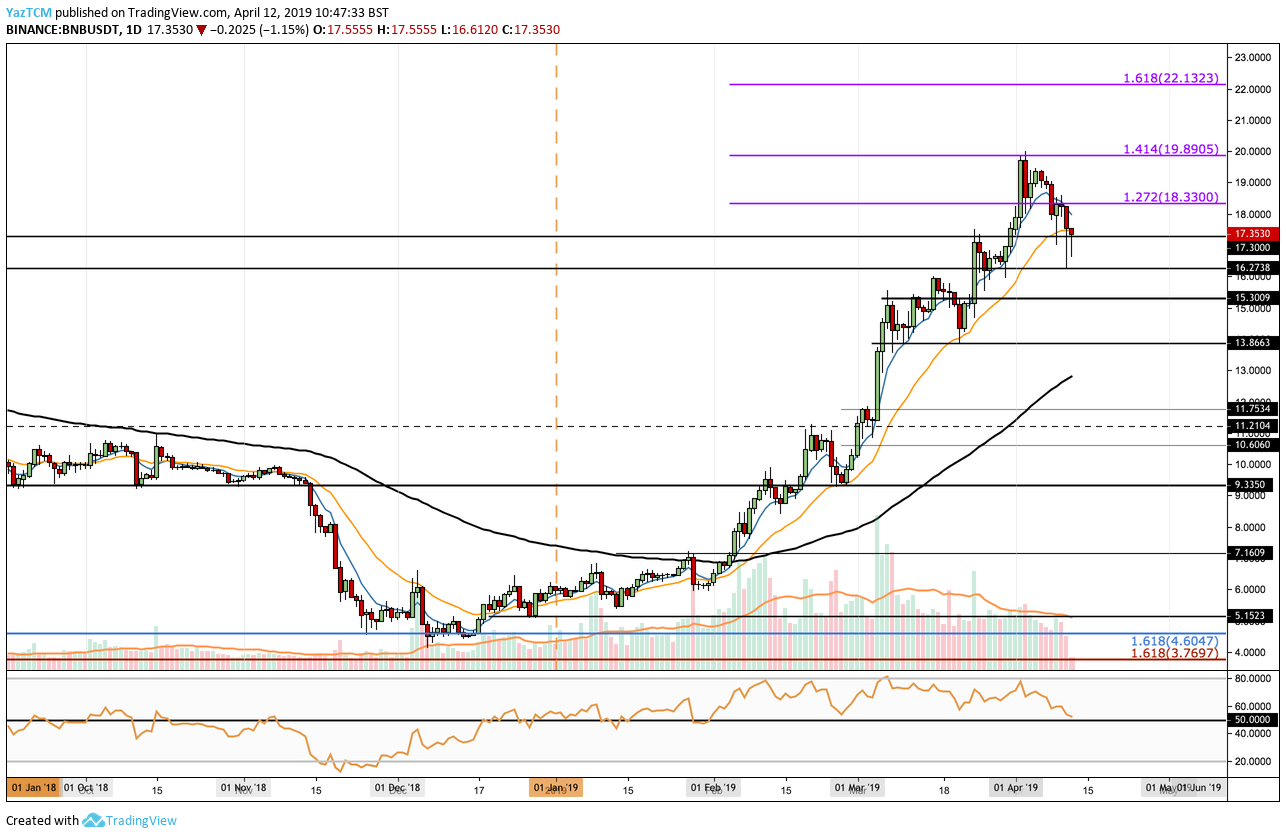
Binance Coin has most certainly been the strongest performing coin out of the top 10 projects after increasing by a gigantic 185% over the past 90 trading days. The market has seen a surge in volume that has allowed BNB to rise into resistance at the $19.89 level.
Since meeting this resistance, BNB has fallen slightly and now trades at support around $17.30. Binance Coin is now ranked in 7th position as it currently holds a $2.46 billion market cap valuation. The RSI had not reached extreme overbought conditions all year round which shows how healthy the Binance Coin price rise has been. The recent drop has now caused the RSI to drop into the 50 area, let’s see if the bulls can hold above.
If the selling continues, support beneath the market is located at $16.27, $15.30, $15.00 and $13.86.
Alternatively, if the RSI can rebound at the 50 level and allow the bulls to start pushing the market higher, we can expect initial resistance above the market at the previous 1.272 and 1.414 Fibonacci Extension levels (drawn in purple) priced at $18.33 and $19.89, respectively. If the buyers can climb above $20 and create a fresh 15 month high, further resistance is then located at the 1.618 Fibonacci Extension level priced at $22.13.
Binance Coin has increased significantly by 185% over the past 90 days making it the strongest performer in all of the top 10 projects. If the RSI can hold above 50 we can expect the bulls to make another run at the $20 resistance level.
Stellar
XLM/USD – MEDIUM TERM – DAILY CHART
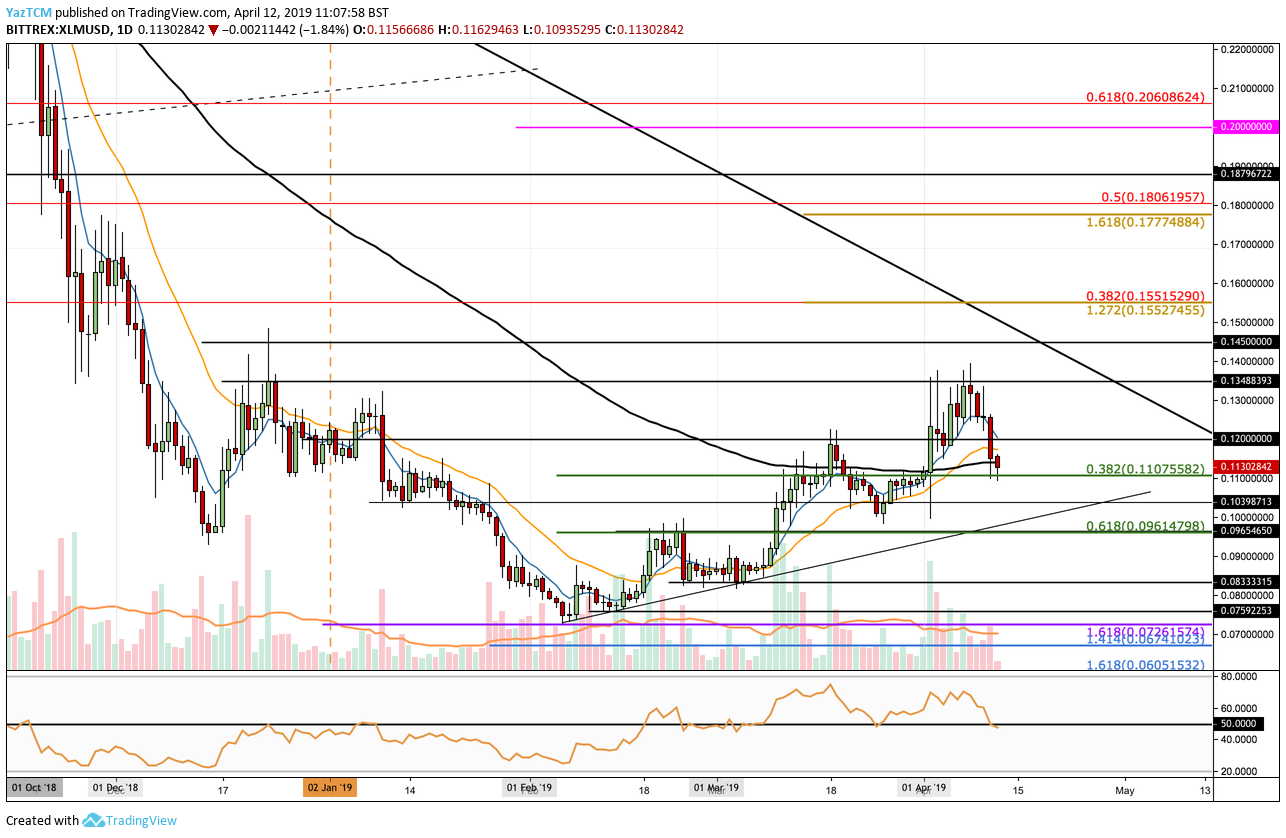
Stellar has also enjoyed some benefit from the BTC bull run, however, not as much as other altcoins. The cryptocurrency has increased by a slight 9% over the past 30 days bringing the price of the coin up to around $0.1130. Despite this, Stellar has been continuously rising from the February 2109 low by a total of 53% to the current trading price.
Stellar had managed to surge into resistance at the $0.1348 level before the market reversed and rolled over. It is now trading at support provided by the short term .382 Fibonacci Retracement level (drawn in green) priced at $0.1175. Stellar is now ranked in 9th position as it holds a $2.19 billion market cap value.
The RSI has recently penetrated slightly below the 50 level which indicates that the bears may be taking control of the market momentum. IF the selling continues lower, we can expect initial support to be located at $0.103, $0.100 and then at the .618 Fibonacci Retracement level at $0.09614.
Alternatievly, if the RSI can hold above 50 and allow XLM/USD to climb higher, resistance can be expected at $0.12, $).1348 and then at a long term, 12 month old, descending trend line. Above the trend line, further resistance is expected at the bearish .382 Fibonacci Retracement level priced at $0.155.
Stellar has been increasing since the February 2019 price low and has recently managed to reach $0.1348. If the RSI remains above 50, Stellar will head higher into resistance provided by a 12 month old descending trend line.
Cardano
ADA/USD – MEDIUM TERM – DAILY CHART
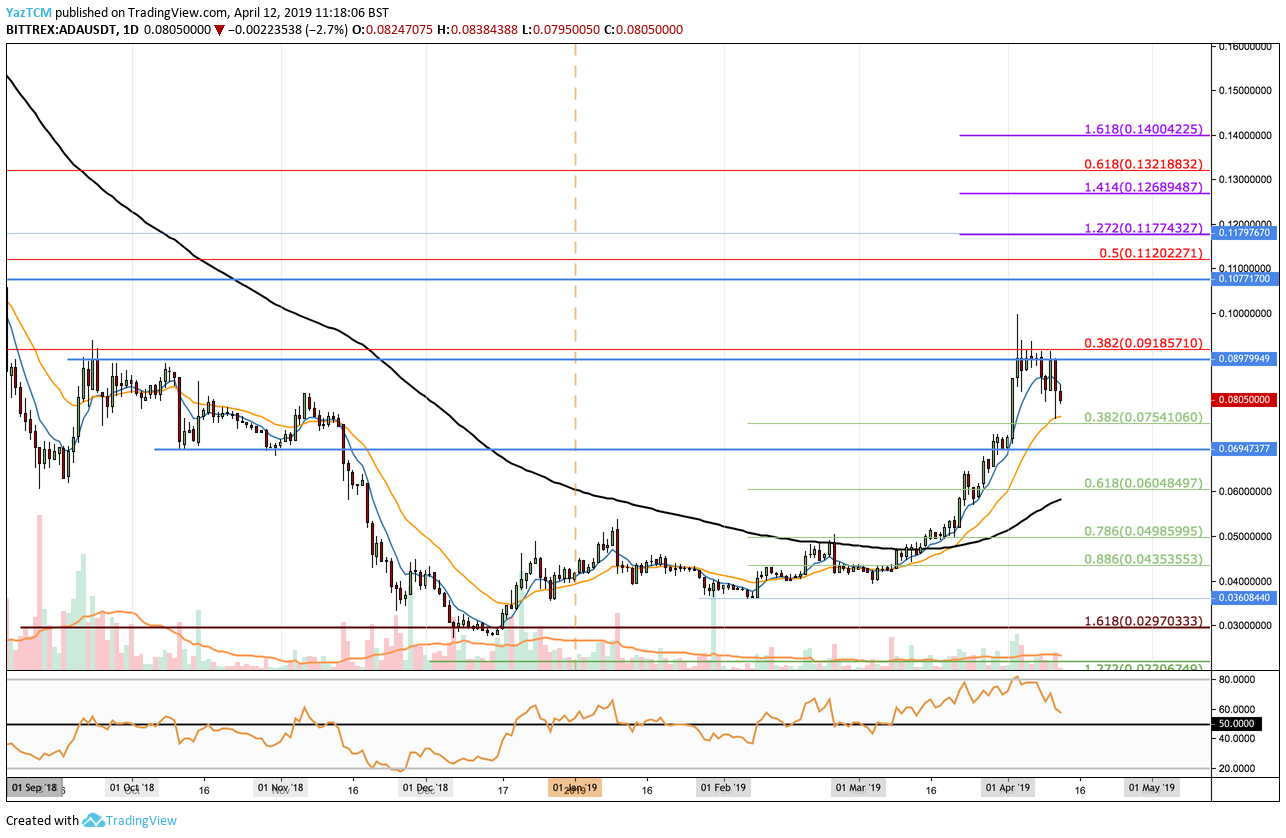
Cardano has also seen an impressive price surge after the cryptocurrency has risen by a total of 74% over the past 30 days. Cardano had managed to break above the 100 day moving average in February 2019 and has surged ever since. The cryptocurrency had risen into resistance provided by a long term bearish .382 Fibonacci Retracement level (drawn in red) priced at $0.09185 before rolling over and falling. Cardano is now trading at a price of $0.08050.
Cardano is ranked in 10th position as it presently holds a $2.14 billion market cap valuation. If the selling continues, we can expect immediate support at the short term .382 Fibonacci Retracement level (drawn in green) priced at $0.0754. This is then followed with more support at the $0.069 level. Further support toward the downside can then be expected at $0.60 which is bolstered by the short term .618 Fibonacci Retracement level and the 100 day moving average.
The RSI is falling rapidly which signals that the bullish trend is fading quickly. However, if the bulls can keep the RSI above 50 and allow ADA/USD to reverse, we can expect immediate resistance above to be located at the $0.09 level. If the buyers break above $0.10, further resistance is then expected at $0.107 and at the bearish .5 Fibonacci Retracement level (drawn in red) priced at $0.1120.
Cardano has been on an epic 74% price rise over the past 30 days. However, the RSI is rapidly falling as the bullish pressure deteriorates. If the RSI can remain above 50 and allow ADA/USD to rebound, we could see the market attempting to break back above the $0.10 level.
Tron
TRX/USD – MEDIUM TERM – DAILY CHART
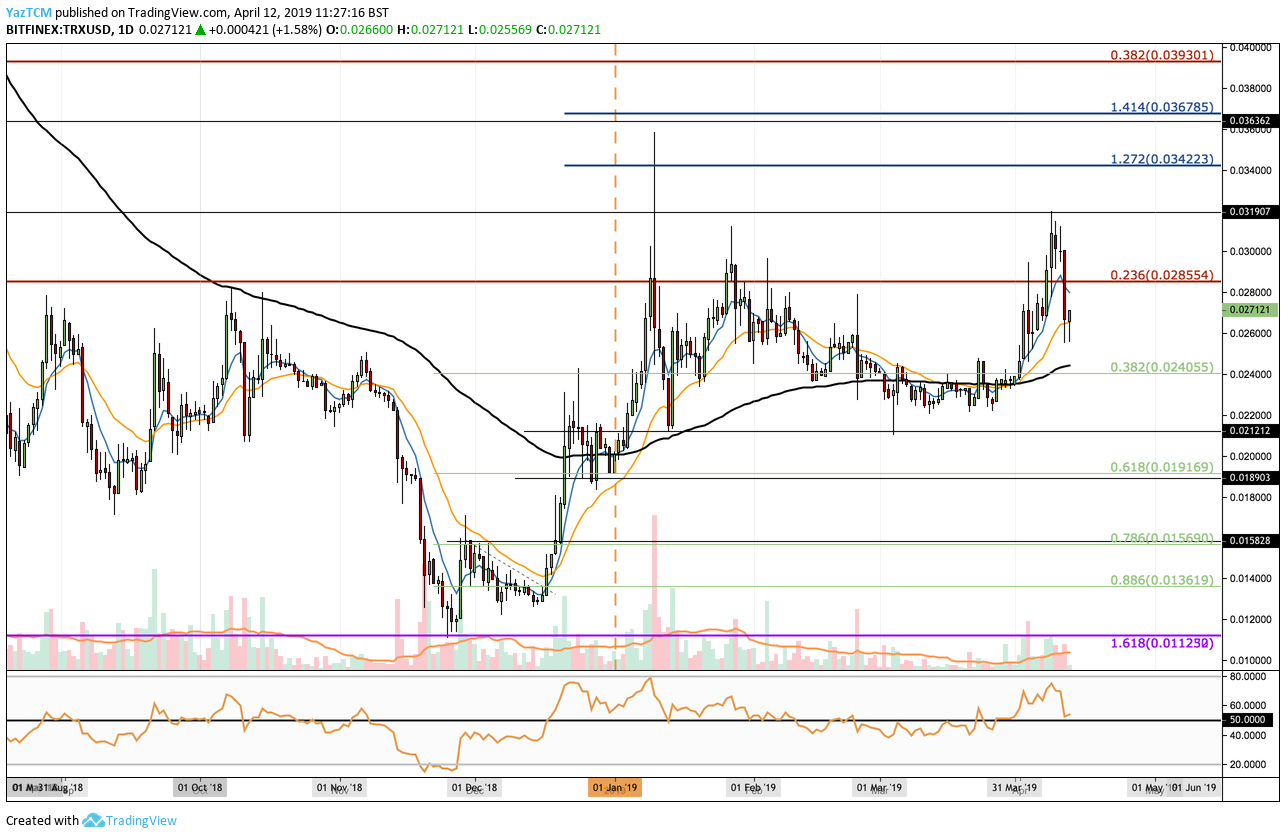
Tron has only partly enjoyed a price increase which totals 20% over the past 30 days, the returns from the BTC price increase have been rather muted. Despite this, Tron had managed to create a fresh closing high above the $0.031 level which still counts as good progress.
The market has slipped from this high, back below $0.030 and now trades at the $0.027. Tron is presently ranked in the 11th position as it holds a $1.80 billion market cap value. The RSI has also recently fallen into the 50 level but it looks like the RSI may be able to rebound and remain in bullish territory.
If the selling continues, initial support is located at the .382 Fibonacci Retracement level (drawn in green) priced at $0.024. This is then followed by support at $0.0212. If the selling causes TRX/USD to head below $0.020, support below is located at the .618 Fibonacci Retracement level (drawn in green) priced at $0.019.
Alternatively, if the RSI rebounds and causes TRX/USD to head higher, initial resistance is located at the $0.0285 and $0.030 levels. Above $0.03, more resistance is located at the 1.272 and 1.414 Fibonacci Extension levels (drawn in blue) priced at $0.034 and $0.036.
Tron has seen a rather muted price increase after the BTC surge. If the RSI can remain above 50, we can see Tron rising back above the $0.030 level and head higher. Alternatively, Tron may drop toward $0.020 if the selling continues.
IOTA
IOTA/USD – MEDIUM TERM – DAILY CHART
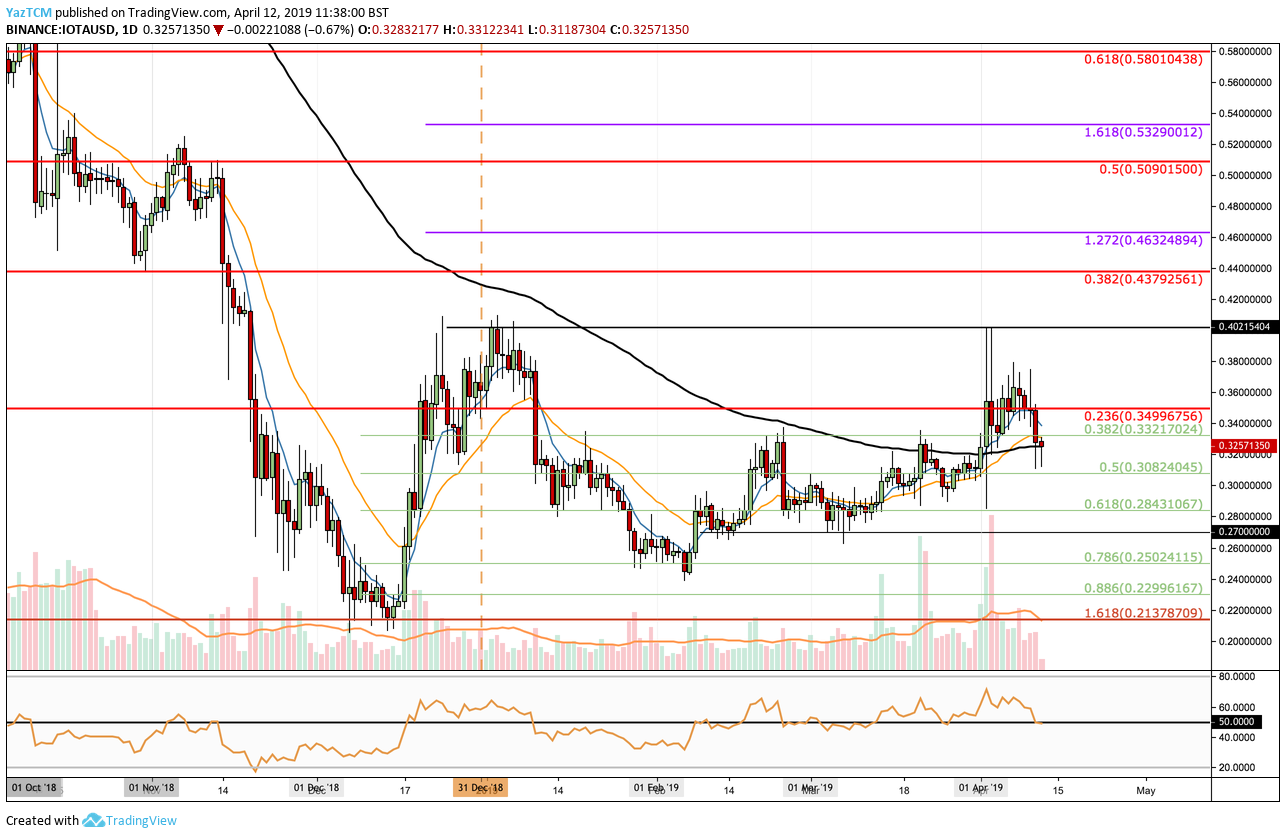
IOTA is another cryptocurrency that has only seen a rather muted price increase of 12% over the past 30 days. The cryptocurrency had attempted to spike higher above the 2019 high but failed to overcome the resistance at $0.40. The market has since retracted and is now trading at the support provided by the 100 day moving average at the $0.3257 level.
The RSI has recently also reached the 50 level which indicates indecision within the market. IOTA is now ranked in 15th position as it presently holds a $889 million market cap valuation.
If the RSI drops below 50 and the selling continues, we can expect immediate support at the short term .5 and .618 Fibonacci Retracement levels at $0.30 and $0.2843. Beneath this further support can be located at $0.27, $0.25 and $0.23.
Alternatively, if the RSI breaks above 50 and causes IOTA/USD to rise, initial resistance is expected at $0.35 and $0.40. If the buyers can drive IOTA/USD above $0.40 to create a fresh 2019 high, further resistance is located at the bearish .382 Fibonacci Retracement level (drawn in red) priced at $0.4379 and at $0.4632.
IOTA is currently in a period of indecision as indicated by the RSI at the 50 level. For the next IOTA move, we will need to allow the market to dictate in which direction it would like to head toward.