
- Bitcoin continues to tumble, creating a fresh 2018 low at $3,368.
- The technical indicators continue to suggest that BTC price has room to head lower.
- Support moving forward: $3,405, $3,263, $3,154, $3,083, $3,000, $2,885, $2,482, $2,356.
- Resistance moving forward: $3,600, $3,701, $3,906, $4,000, $4,100.
The troubles continue for the Bitcoin market (and the rest of the cryptocurrency market) as BTC/USD plunges further today to reach a fresh yearly low at $3,368 (on Bitfinex).
The fall comes after a month of continuously decreasing prices as the market dropped beneath the long-lived support handle at $6,000 in mid-November 2018. Price action continued to drop further as the month progressed but managed to show some refuge around the $3,700 – $3,600 area toward the end of the month.
However, this all changed when Bitcoin continued to tumble, creating brand new yearly lows during this morning’s (December 7) trading session.
The drop has been largely attributed to the SEC, once again, delaying the VanEck ETF proposal until February 27, 2019. The majority of experts were expecting the ETF to be delayed but Bitcoin still felt the impact as markets slipped lower.
Bitcoin has lost over 9.97% during the past 24-hour trading period as the market is presently battling with the $3,400 handle, at the time of writing. The cryptocurrency giant has now lost 20% over the past 7 trading days and a steep 47% over the past 30 trading days.
BTC market cap has now slipped below $60 billion to where it is currently trading at $59.08 billion. BTC is currently trading at a price that is 82% lower than its all-time high.
Let;s take a look at how the market is holding up.
Bitcoin Price Analysis
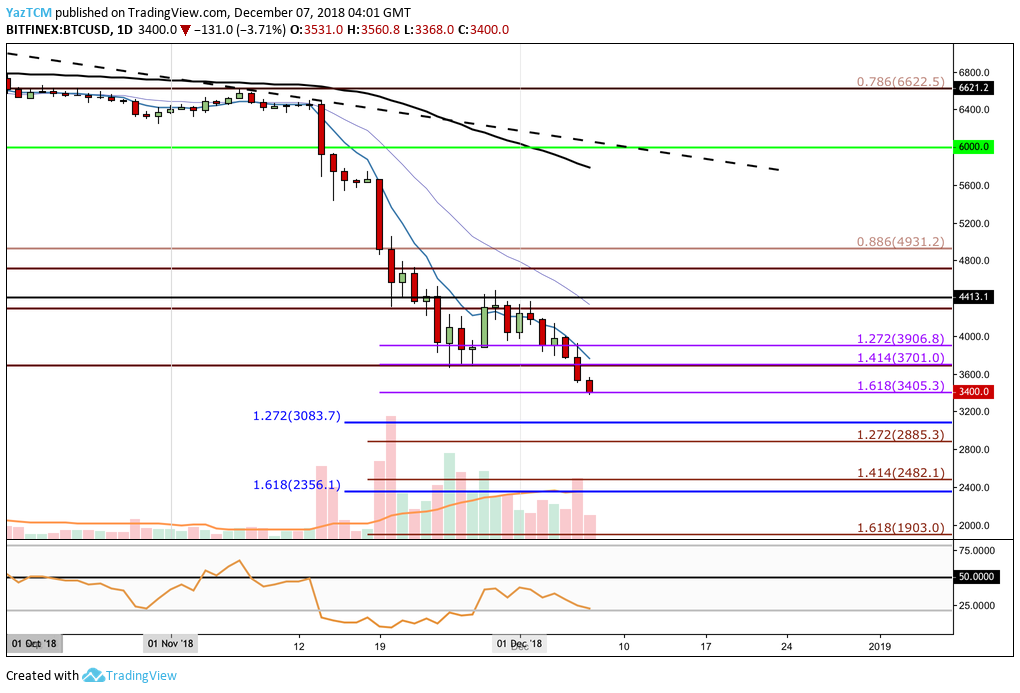
Analyzing the market from the short-term daily chart above, we can clearly see that the bearish trend seen during November has started to continue in December.
Price action has now reached support at a short-term downside 1.618 Fibonacci Extension level (drawn in purple) priced at $3405.
Due to the nature of the bearish beast in play, this support level is not expected to hold for very long. When price action does break below the short-term support at $3,405, we can expect immediate significant support below to be located at the medium-term downside 1.272 Fibonacci Extension level (drawn in blue) priced at $3,083, followed by the psychological round number support at $3,000.
If the sellers then continue to break below the $3000 handle, further support can be located at the downside 1.272 and 1.414 Fibonacci Extension levels (drawn in brown), priced at $2,885 and $2,482 respectively.
More support below can then be located at the medium-term downside 1.618 Fibonacci Extension level (drawn in blue), priced at $2,356, followed by the $2,000 round number level.
The RSI is not even trading in oversold conditions at this moment in time which indicates that there is much more room for BTC/USD to slip further lower.
Conclusion
The storm is still not over for the Bitcoin markets.
As Bitcoin continues to drop further, we can foresee that this will also impact the rest of the cryptocurrency industry as we expect many investors to continue to exit the market due to fear and uncertainty about how low the market may drop.
Moving forward, the $3,000 round number level will be a crucial support now for Bitcoin . If the bulls fail to defend this area, we could expect price action to be heading to the low price of $1,500 as predicted by Bloomberg’s Mike McGlone.