
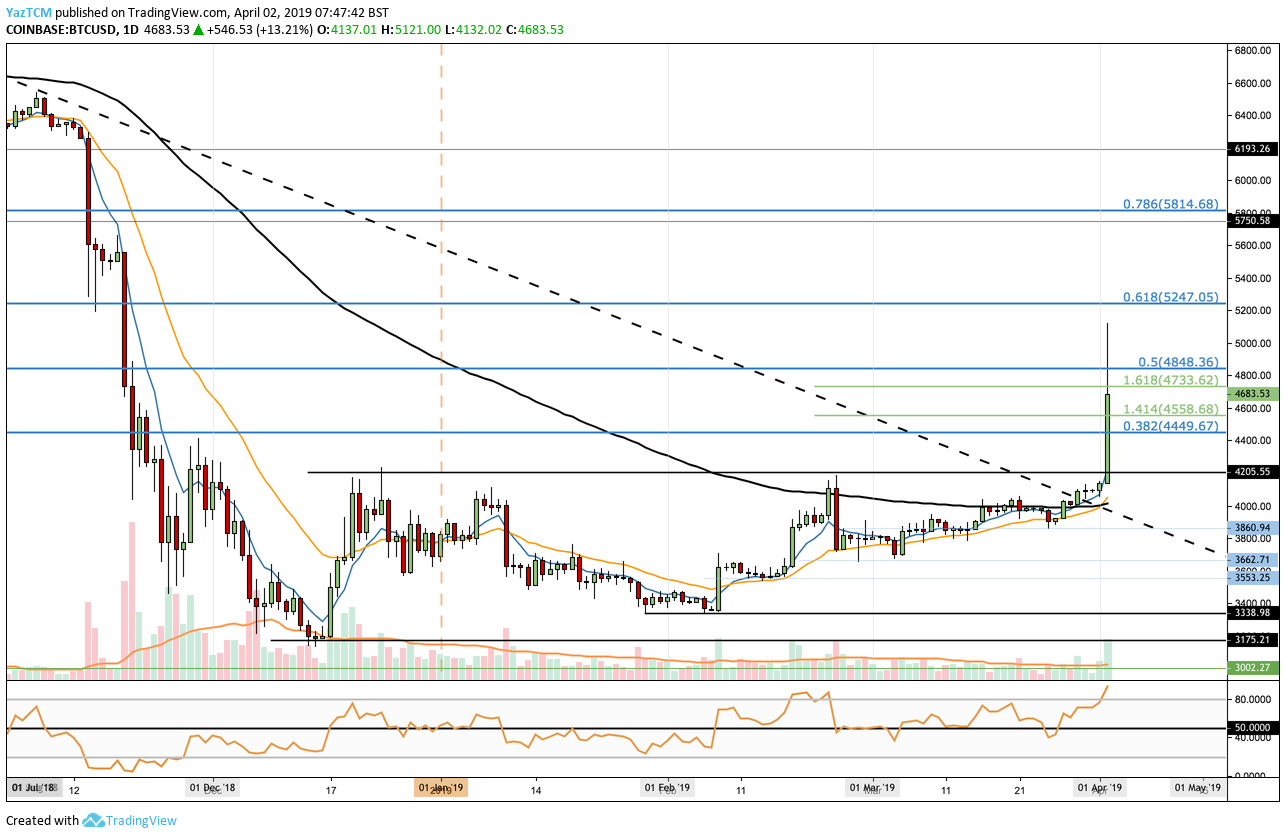
The bulls are back in town after Bitcoin surges by over 22% to spike above the $5,000 level in just 30 minutes. The market has pulled back slightly but this is undoubtedly a fantastic catalyst to see Bitcoin climb back higher again.
Over the past few days, we had signs that Bitcoin was ready to pop after seeing Bitcoin climb above the 100 day moving average and the market break above a long term descending trend line.
Bitcoin has now seen a price increase totaling 17% over the past 7 trading days. The 71-month-old project now has a market cap value of $81.88.
Bitcoin Price Analysis
BTC/USD – 1 DAY CHART – SHORT TERM
What Has Been Going On?
Bitcoin had been battling with the 100 day moving average during the month of March 2019. The cryptocurrency had managed to penetrate above the 100 day moving average toward the end of the month creating the first bullish signal. The break above the 100 day moving average was the first time Bitcoin had managed to do this since September 2018.
The next bullish signal came when Bitcoin managed to also break above a long term descending trend line that has been in play for over 11 months.
We can see that the price spike had caused Bitcoin to rally from a low around $4200 to reach a high above $5000 around $5121. The market has pulled back below $5000 again as it currently trades around $4683.
What Is The Current Short Term Trend?
The current short term trend for Bitcoin is most certainly bullish.
Where Is The Market Likely To Head Next?
We can see that after spiking higher, the market pulled back slightly. It is now trading above a short term 1.272 Fibonacci Extension level at $4558.
Moving forward, if the bulls can keep the pressure on and cause Bitcoin to rise higher again, initial resistance is located at the short term 1.618 FIbonacci Extension level at $4733. This is closely followed with more resistance at the long term bearish .5 FIbonacci Retracement level priced at $4848. This bearish Fibonacci Retracement level is measured from the November 2018 high to the December 2018 low.
Above $4848, the next level of resistance is located at the $5000 level. This is then followed with resistance higher at the bearish .618 FIbonacci Retracement level priced at $5247.
What If The Sellers Step Back In?
Alternatively, if the sellers group up and begin to push the market lower again, we can expect immediate support below at the bearish .382 FIbonacci Retracement level priced at $4449. Below this we can expect support to be located at $4205 and $4000.
What Are The Technical Indicators Showing?
The RSI has now risen into overbought conditions which could potentially signal that the market is too far overextended. So long as the RSI can remain above 50 on the pullback, we can assume that the bulls will remain in charge of the market.
Conclusion
The recent price surge may have come as a shock to many. However, the market has been showing signs that it has been ready to move for a while now. The most notable signals came from the break above the long term descending trend line and the break above the 100 day moving average.
If the bulls can keep the pressure on, we can expect Bitcoin to climb back above $5000 and remain there within the next few days.