
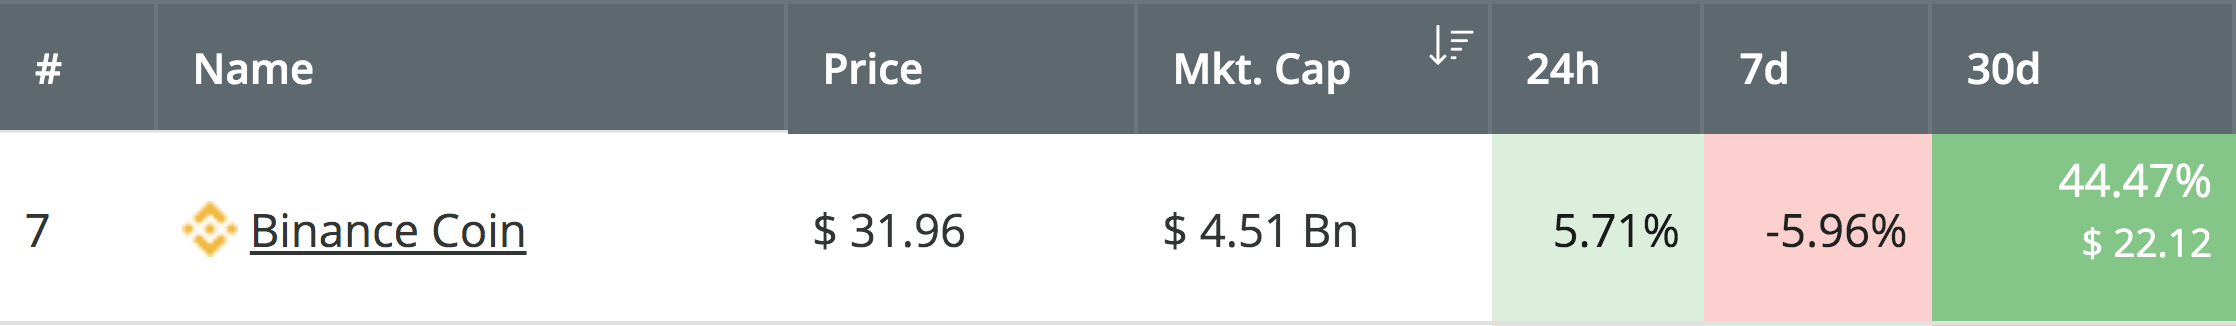
Binance Coin seems to have started its recovery after the recent cryptocurrency bloodbath. Binance Coin has seen a 5.71% price rebound over the past 24 hours of trading, allowing the coin’s price to rise back above the $30 mark to trade at around $31.18.
The cryptocurrency has seen a 6% price drop over the past 7 trading days, but has still seen a remarkable 42% price increase over the past 30 days, with a further impressive 104% price increase over the past 3 months.
Source: CoinCheckup
Binance Coin is currently ranked in 7th position amongst the top cryptocurrency projects by market cap value, as it currently holds a $4.51 billion market cap.
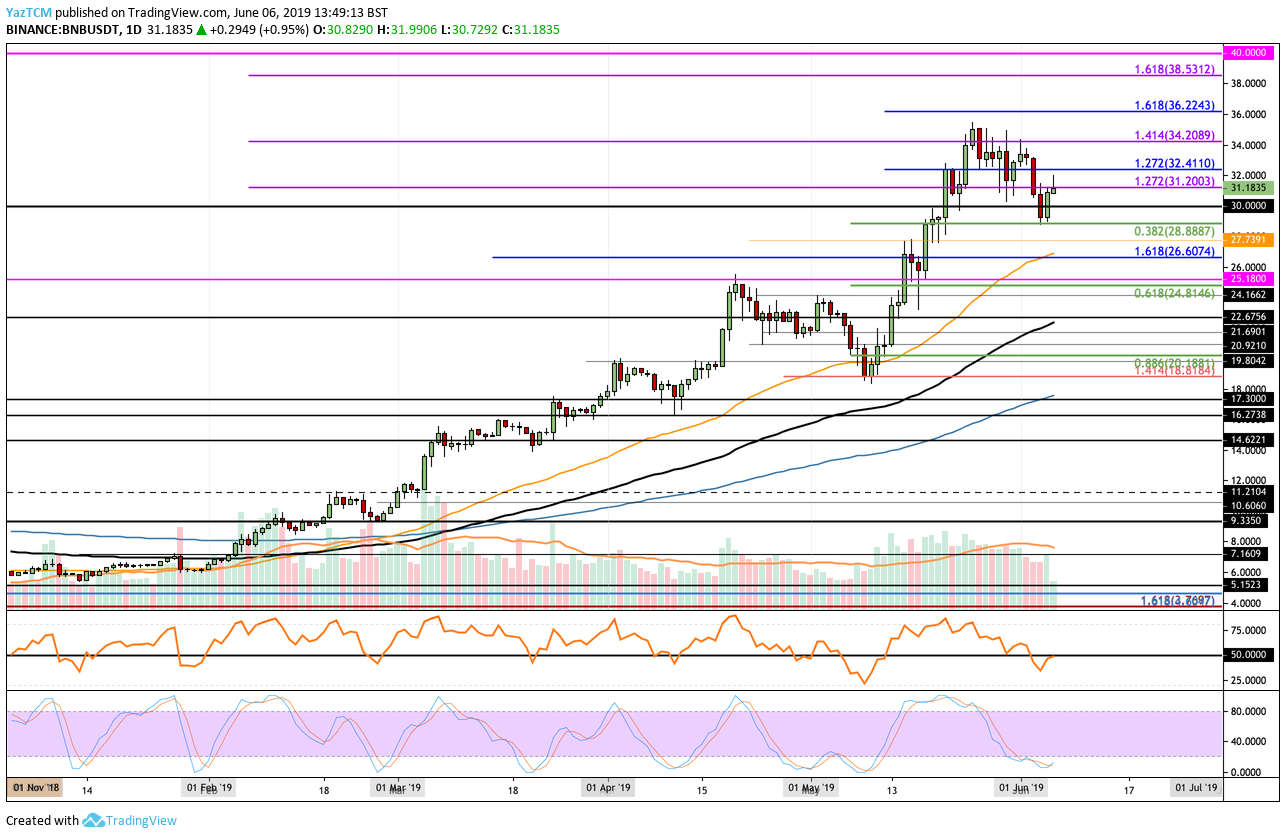
The cryptocurrency recently rebounded from support at the short-term .382 Fibonacci Retracement level at around $28.88. This latest bounce may help create a fresh ATH for Binance Coin above the $35 level.
Let us continue to analyze BNB/USD and highlight some potential areas of resistance moving forward.
Binance Coin Price Analysis
BNB/USD – MEDIUM TERM – DAILY CHART
What Has Been Going On?
Analyzing the daily chart for BNB/USD above, we can see that toward the end of May 2019, Binance Coin reached a high around $35 and rolled over. The cryptocurrency continued to fall during June 2019, but we can see that BNB/USD recently bounced at support provided by the short-term .382 Fibonacci Retracement level (drawn in green), priced at $28.88. This level should continue to provide strong support for the market moving forward.
What Is the Current Trend?
The current trend for the market is bullish. For this bullish trend to be invalidated, we would need to see Binance Coin fall and break beneath the $28.88 support level. If Binance Coin was to continue to fall further lower and drop beneath $25.18, we could then consider the short-term trend to be bearish.
Where Can the Recent Rebound Take Us?
If the buying pressure continues to build and allows BNB/USD to break above the current resistance around the $31.20 level, we can expect immediate higher resistance above to be located at the short-term 1.272 Fibonacci Extension level (drawn in blue), priced at $32.41.
Above this, further higher resistance is then located at the medium-term 1.414 Fibonacci Extension level (drawn in purple), priced at $34.20. If the bulls continue to drive Binance Coin above the $35 resistance level, we can then expect more resistance to be located at the short-term 1.618 Fibonacci Extension level (drawn in blue), priced at $36.22. This is then followed with resistance at the medium-term 1.618 Fibonacci Extension level (drawn in purple), priced at $38.53.
If the bulls can clear the resistance at $38.53, the next level of resistance above is located at the $40 level.
Where Is the Support Beneath the Market?
Alternatively, if the sellers regroup and push the market lower – we can expect immediate support beneath the market to be located at $30 and $28.88. If the selling continues beneath $28.88, further support is then expected at $27.72, $26.60, $25.18, $24.81, and $22.67.
What Are the Technical Indicators Showing?
The Stochastic RSI is currently trading in extreme oversold conditions, which indicates that the market may continue this rebound further higher. If BNB is to climb above the current resistance, we would also need to see the RSI penetrate above the 50 level.
Conclusion
Binance Coin has been one of the strongest-performing cryptocurrencies during 2019, and is also one of the only ones to create a fresh ATH. The recent rebound at the $28.88 level seems like it will take Binance Coin much higher, which could possibly allow the cryptocurrency to create another fresh ATH above $36.