
Binance Coin Price Analysis
Binance Coin (BNB) has been on a tear recently as the cryptocurrency has surged by a total of 61% over the past 30 trading days. BNB has seen a 17% price rise over the past 8 trading days. The coin has now seen a 6.90% price hike over the past 24 hours, bringing the current trading price up to around $9.43, at the time of writing.
Binance has now sailed into 10th position in the market cap rankings, surpassing Cardano, IOTA and Monero as it currently holds a market cap value of $1.34 billion.
BNB/USD Price
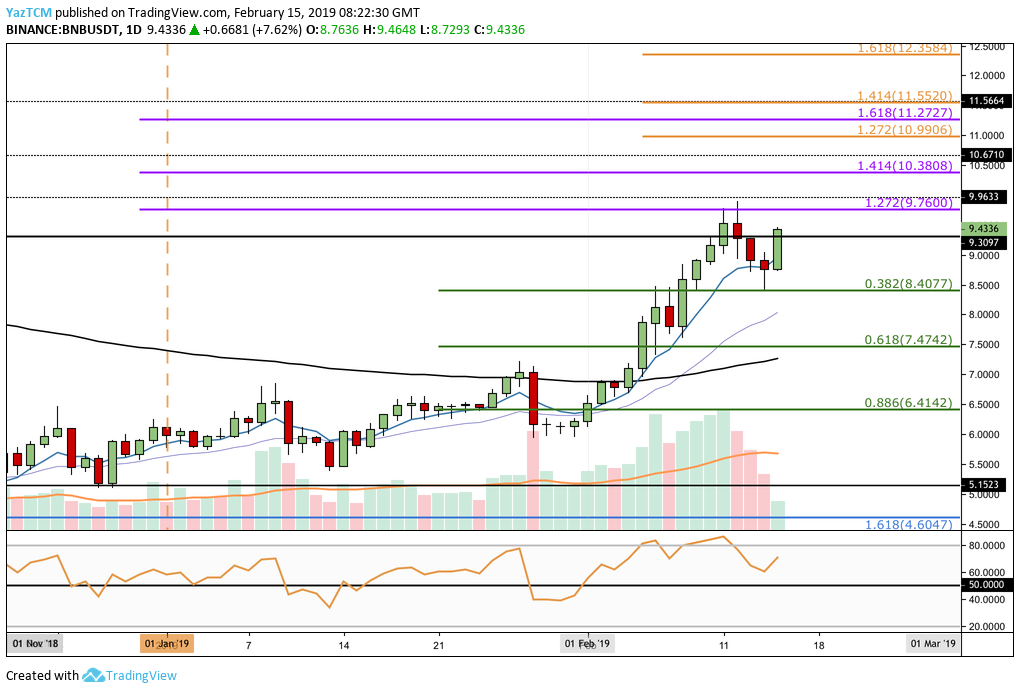
Taking a look at the daily chart above for BNB/USD, we can clearly the see bullish rally heating up during the month of February 2019. The market had started at a low around $6.00 and continued to aggressively rally into a high above $9.00.
The market met resistance at a medium-term 1.272 Fibonacci Extension level (drawn in purple) priced at $9.76 before the bullish momentum stalled momentarily and rolled over.
The market then experienced a small drop in volume traded as price action went on to fall into support at the short-term .382 FIbonacci Retracement level (drawn in green) priced at $8.40. Then, price action for BNB rebounded back above $9.00 to where it is currently trading at the $9.43 handle.
Trend: Bullish
The trend is undoubtedly strongly bullish at this moment in time. For this bullish run to continue, we will now need to see the market break above the resistance at the $9.76 handle.
If this market falls below the $7.50 handle, we can consider the market to be on the brink of turning bearish in the short term.
Where is the Market Likely to Head Towards Next?
The bullish momentum has been re-ignited today after close to a 7% increase in price.
If this bullish momentum persists, we can expect immediate resistance above to initially be located at the medium-term 1.272 Fibonacci Extension level (drawn in purple) priced at $9.76. This is closely followed by resistance at the November 2018 high, priced at the $9.96 handle.
If the buyers drive BNB above the $10.00 handle, there is higher resistance located at the medium-term 1.414 Fibonacci Extension level (drawn in purple) priced at $10.38, followed by resistance at the $10.67 level.
More resistance towards the upside can then be expected at the short-term 1.272 Fibonacci Extension level (drawn in orange) priced at $10.99. The next area of resistance is located at the medium-term 1.618 Fibonacci Extension level (drawn in purple) priced at $11.27.
If the bullish momentum pushes BNB/USD even higher, we can expect resistance above $11.27 to be located at the short-term 1.414 and 1.618 Fibonacci Extension levels (drawn in orange), priced at $11.55 and $12.35 respectively.
What if the Sellers Regain Control?
Alternatively, if the bears regroup and begin to push the market lower again, we can expect immediate support below at the $9.00 level, followed by support at the short-term .382 Fibonacci Retracement level (drawn in green) priced at $8.40.
If BNB/USD goes below the $8.00 level, there is support at the short-term .618 Fibonacci Retracement level (drawn in green) priced at $7.42, followed by more support at the $7.00 level.
BNB/BTC Price
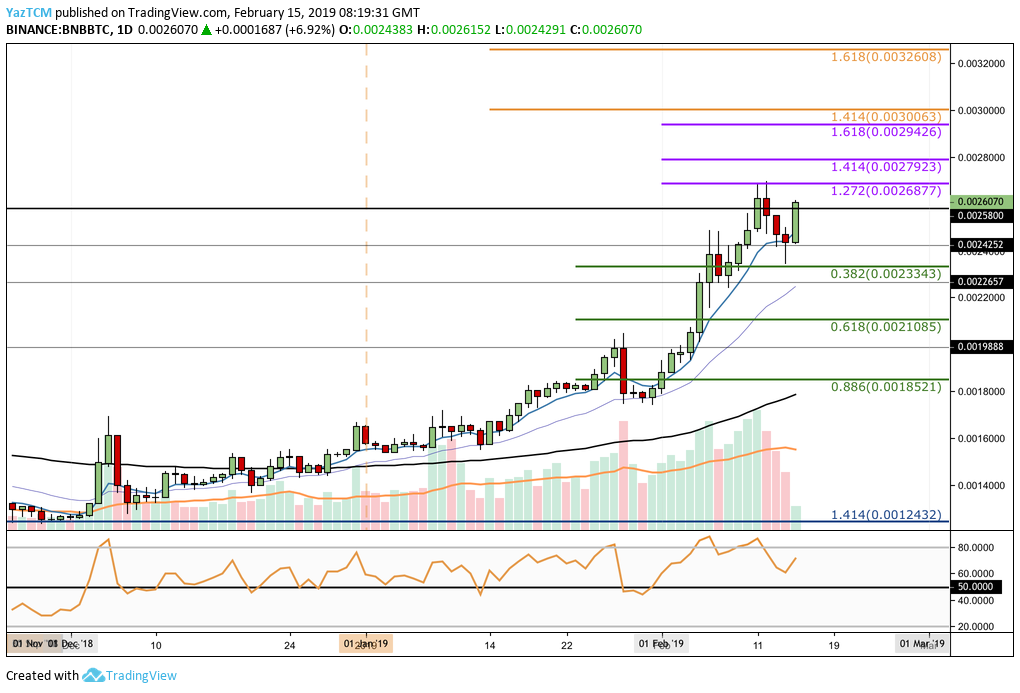
Analysing the BNB/BTC 1-day chart above, we can see that Binance Coin had also surged against Bitcoin significantly throughout February 2019. The market had started at a low around the 18,000 SATS handle and continued to sail above the 26,000 SATS handle.
The market had met resistance at a short-term 1.272 FIbonacci Extension level (drawn in purple) priced at 26,877 SATS before the bullish momentum had stalled. As price action reached this high, this marked a new all-time high for BNB/BTC.
However, after a brief pull back into support at the short-term .382 Fibonacci Retracement level (drawn in green) priced at 23,343 SATS, we can see that the bulls have now started their push higher once again.
Trend: Bullish
The market for BNB is also bullish against BTC. For this market to be considered bearish in the short term, we would need to see price action fall beneath the 23,343 SATS level.
Where is the BNB/BTC Market Likely to Head Towards Next?
If the bulls cause BNB/BTC to rise above the resistance at the 26,877 SATS level, we can expect higher resistance at the short-term 1.414 and 1.618 FIbonacci Extension levels (drawn in purple), priced at 27,923 SATS and 29,426 SATS.
If the buyers continue to drive BNB above the 30,000 SATS level, there is higher resistance at the medium-term 1.414 and 1.618 FIbonacci Extension levels (drawn in orange), priced at 30,063 SATS and 32,608 SATS respectively.
What if the Sellers Drive BNB/BTC Price Lower?
Alternatively, if the sellers regroup once again and push price action lower, we can expect immediate support towards the downside to be located at the 24,252 SATS level. The next level of support is located at the short-term .382 Fibonacci Retracement level (drawn in green) priced at 23,343 SATS.
If price action continues to drop and fall below 22,000 SATS, there is more support at the short-term .618 Fibonacci Retracement level (drawn in green) priced at 21,085 SATS, followed by support at the January 2019 high day close price at 19,888 SATS.
Conclusion
The Binance Coin price increase makes it the strongest performer in top 30 coins over the past trading month.
If we see BNB/USD break and close above the resistance at the $9.76 handle, we can expect Binance Coin to easily continue higher and break above $10.00.