- SALT is currently trapped within a narrow trading range between $0.2970 and $0.2190.
- Support moving forward: $0.2372, $0.2257, $0.2190, $0.1962.
- Resistance moving forward: $0.2970, $0.3538, $0.4590, $0.5439, $0.6289, $0.7498.
Salt has seen a price increase totalling a small 1.37% over the previous 24-hour trading period. The cryptocurrency is now exchanging hands at a price around $0.25 after seeing a 30-day price hike totaling 12.56%.
Salt is now ranked in 148th position and currently holds a small $20 million market cap value. The cryptocurrency has lost a total of 54% over the past 90 trading days as the 15-month old project now trades at a value that is 98% lower than the all-time high price.
Let us continue to take a look at price action for SALT/USD over the medium term and continue to highlight any potential areas of support and resistance moving forward.
SALT/USD Price Analysis
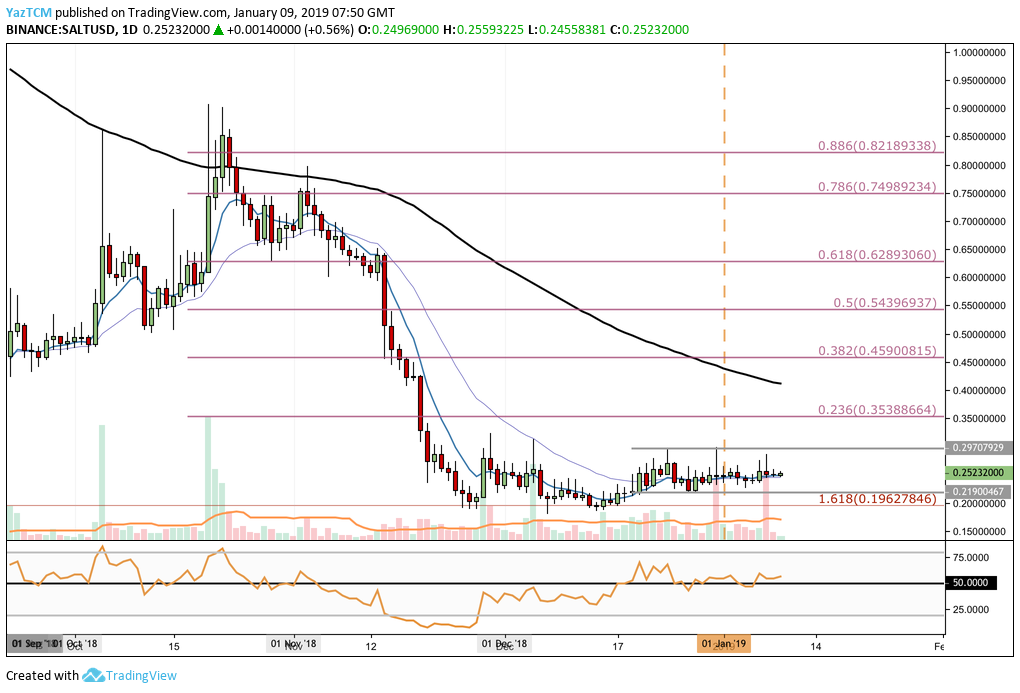
Analyzing the SALT/USD market from the medium-term perspective above, we can see that since our previous analysis for SALT, the market approached our long-term support level highlighted at the downside 1.618 FIbonacci Extension level (drawn in red) priced at $0.1962.
As price action reached this area of support, the previous long-term downtrend ceased, causing the market to rebound and trade sideways. On the rebound, the market reached resistance around the $0.29 handle and was unable to overcome this level of resistance.
We can see that over the past couple of weeks, price action has now been trading within a solid range defined between $0.29 as the upper boundary and $0.21 as the lower boundary of the range.
Trend: Neutral
As the market is trading within a range, price action is within a neutral trend. For this market to be considered bullish again, we would need to see price action break above the upper boundary of the range at $0.29.
If price action was to break below $0.19, we can consider that the bearish market will continue to push price action lower again.
Where is the Resistance Above the Trading Range?
If the bulls manage to gather some momentum and push price action above the upper boundary of the trading range, they will encounter immediate resistance toward the upside at the bearish .236 Fibonacci Retracement level (drawn in lilac) priced at $0.3538.
This Fibonacci Retracement is measured from the market high seen during October 2018 to the market low seen during December 2018.
If the bulls can continue to travel higher and break above the $0.40 handle, we can expect further resistance to be located at the bearish .382 and .5 FIbonacci Retracement levels (drawn in lilac), priced at $0.4590 and $0.5439 respectively.
More resistance towards the upside above $0.60 can be expected at the bearish .618 and .786 Fibonacci Retracement levels (drawn in lilac), priced at $0.6289 and $0.7498 respectively.
Where is the Support Beneath the Market?
If the sellers re-engage within the market and begin to push price action lower, we can expect immediate support towards the downside to be located at short-term .5 and .618 Fibonacci Retracement levels (not displayed on the chart), priced at $0.2372 and $0.2257 respectively.
This is followed by the lower boundary of the trading range priced at $0.2190.
Further support below the trading range can be expected at the previous long-term downside 1.618 Fibonacci Extension level (drawn in red) priced at $0.1962.
What are the Technical Indicators Showing?
For the past few weeks, the RSI has been fluctuating around the 50 handle. This indicates the indecision within the market, represented by the tight trading range the market is within.
If the RSI can travel higher above the 50 handle and continue upward, we can expect price action to break above the current trading range.
Let us continue to take a look at SALT against BTC over the same period and highlight any potential areas of support and resistance moving forward.
SALT/BTC Price Analysis
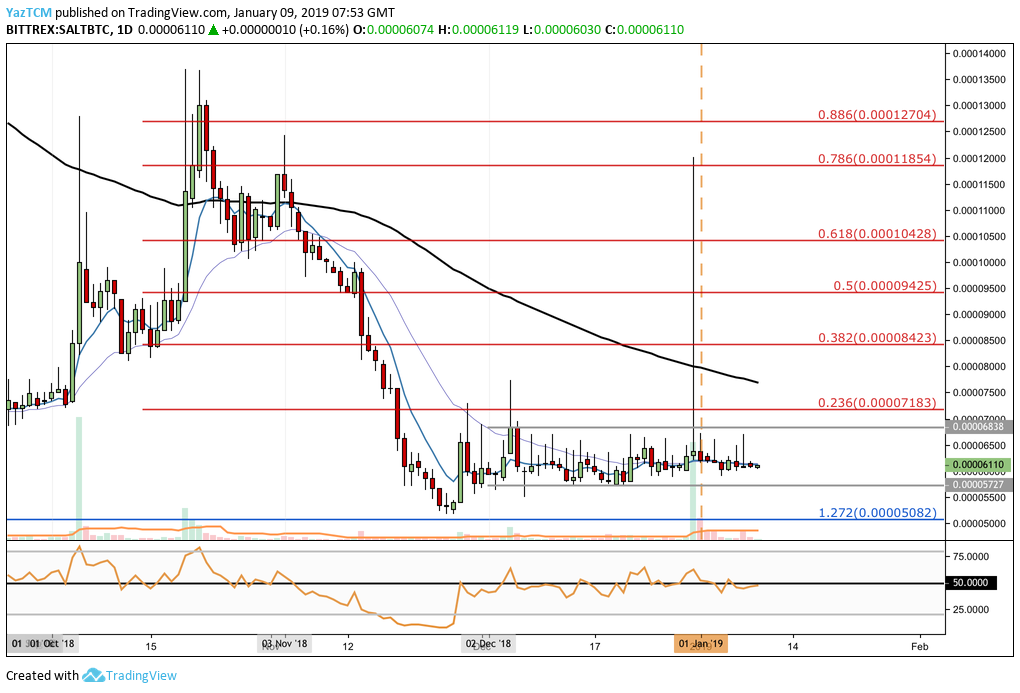
Taking a look at the daily chart above for SALT/BTC, we can see that the recent price decline has caused price action to approach our previously highlighted long-term support provided by a downside 1.272 FIbonacci Extension level (drawn in blue) priced at 5,082 SATS.
Price action stalled just slightly above this level at the 5,407 SATS handle.
The market then attempted to rebound but met resistance at a bearish .236 Fibonacci Retracement level (drawn in red) priced at 7,183 SATS. This Fibonacci Retracement is measured from the October 2018 high to the December 2018 low.
Price action has now been trading within a narrow range between 6,838 SATS and 5,727 SATS for the past 5 weeks.
Trend: Neutral
As the market is trading within the range, the trend is currently neutral. We would need to see price action break above the 7,200 SATS handle before considering a bullish market, whereas a break below 5,727 SATS could trigger a bearish market.
Where is the Support Towards the Downside?
Immediate support toward the downside is located at the lower boundary of the range priced at 5,727 SATS. This area of support is further bolstered by a short-term .786 Fibonacci Retracement level (not displayed on the chart) priced in the same area.
Support below this level can then be located at the previous long-term downside 1.272 FIbonacci Extension level (drawn in blue) priced at 5,082 SATS.
Where Will the Market Meet Resistance Towards the Upside?
If the bulls can cause SALT/BTC to break above the current trading range at 6,383 SATS, they will meet significant resistance above at the bearish .236 and .382 FIbonacci Retracement levels, (drawn in red) priced at 7,183 SATS and 8,423 SATS respectively.
Further resistance above this level can be expected at the bearish .5 and .618 Fibonacci Retracement levels (drawn in red), priced at 9,425 SATS and 10,428 SATS respectively.
Conclusion
The SALT market, like the majority of altcoins, has taken a beating recently. Price action will need to resolve itself above/below the current trading range before we can estimate in which direction the market will be heading toward next.