Salt has continued its price decline this week suffering a 17% drop over the past 7 trading days. The cryptocurrency is currently trading around $0.45 at the time of writing, and has seen a precipitous price drop totaling 60% over the past 30 trading days.
Salt is a blockchain-based platform that allows users to provide and request blockchain-backed loans. The idea is that users put up their cryptocurrency assets as collateral for a cash loan. This lets the user receive cash for his cryptocurrencies without needing to sell them off in the short run. The lenders can feel comfortable knowing that they have an infrastructure provided to them that is secure and compliant for them to provide crypto collateral-backed loans.
The project was founded by Shawn Owen and has notable advisors such as Erik Voorhees, CEO and founder of ShapeShift. The SALT token is an ERC-20 token that users require to become a member of the SALT platform. The token can also be redeemed as a down payment on loan interest and to receive better rates on loans.
For a more in-depth look into SALT, we recommend you read our “What is SALT“ guide.
Salt is currently ranked 148th in terms of overall market cap across the entire industry. It has a market cap value of $31 million and has seen a 82% price decline over the past 90 trading days. The 11-month old coin, like the rest of the cryptomarket, has significant losses to regain since placing their last all-time high.
Let us continue to analyze price action for SALT over the long term.
Price Analysis
SALT/USD – LONG TERM – DAILY CHART
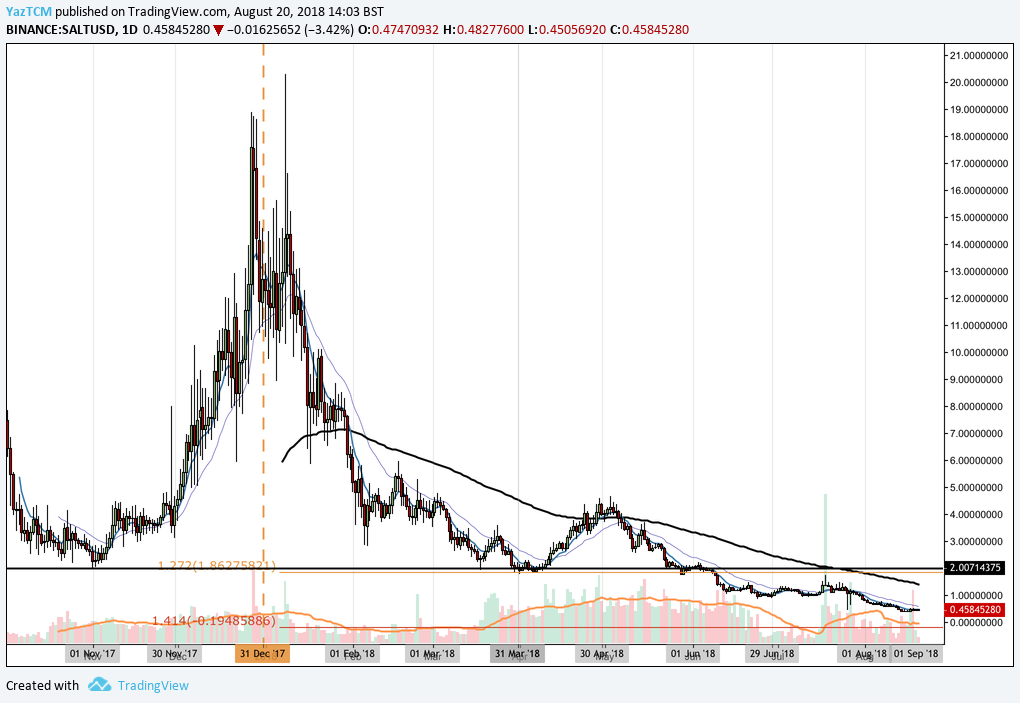
Analyzing the market from the long-term perspective above, we can see that SALT has experienced an extremely tough trading year in 2018. SALT had ended 2017 on a bullish note as price action started from a low of $2.01 on November 1, 2017 and extended to an all-time high of $18.88 on December 27, 2017. This was a price increase totaling 830% from low to high.
After placing the high, price action began to decline rapidly. It had originally found marginal support on the short lived 100-day moving average (SMA) during January, but proceeded to break below the 100-day SMA in February. We can see that the market has still yet to recover above the 100-day SMA .
Price action continued to decline throughout February and March, until it eventually reached support at the price low of $2.01 seen during November 2017. From here, price action made another small bullish run but, ultimately, went on to break below this $2.01 support to make fresh all-time lows within the market.
Let us continue to analyze price action a little closer over the shorter term to highlight any potential support and resistance zones.
SALT/USD – SHORT TERM – DAILY CHART
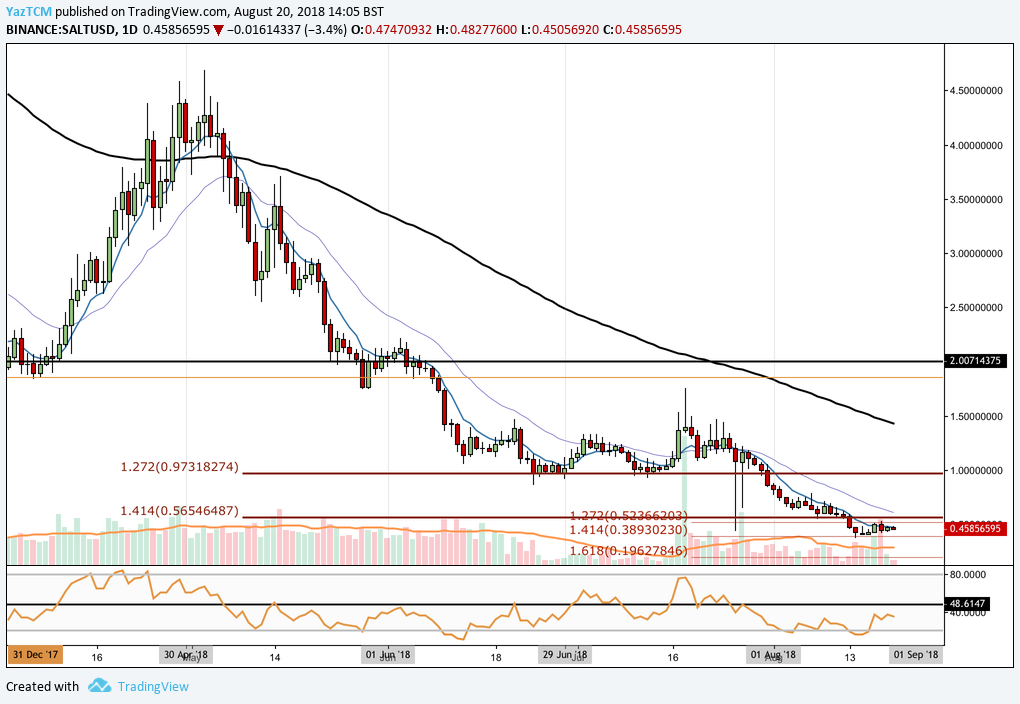
Analyzing the market from a shorter term time horizon, we can see that SALT had experienced another smaller bullish run throughout April 2018 as price action started at a low of $1.79 on April 1, 2018 and extended to a high of $4.68 on May 3, 2018. This was a price increase totaling 156% from low to high.
We can see that, at the high, price action had met resistance marked by the 100-day SMA and proceeded to roll over. During May, price action had found support at the $2.01 handle highlighted above, but continued to fall through this support as June started to trade.
We can see that price action continued to fall in June 2018 until finding support at a downside 1.272 Fibonacci Extension level priced at $0.97. This price level proved its support level throughout the rest of June and July. However, as August began trading, price action fell below this support level and continued below the following downside 1.414 Fibonacci Extension priced at $0.56.
For the sake of simplicity, let us continue analyze the price action in the last couple months a little closer to highlight any potential support and resistance zones.
SALT/USD – SHORTER TERM – DAILY CHART
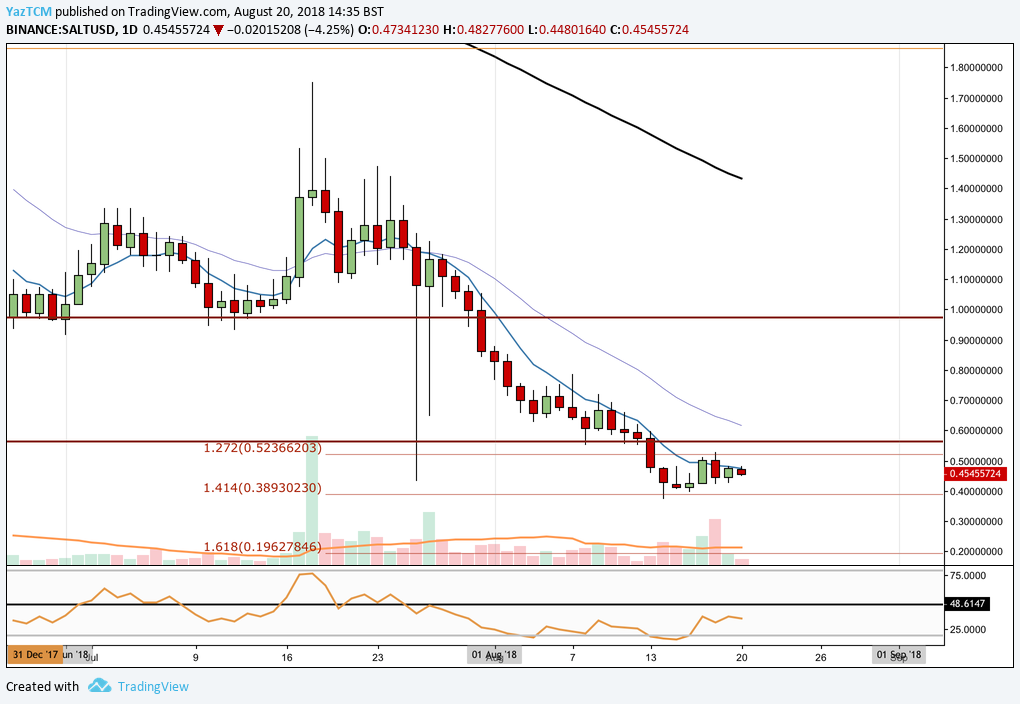
We can see that SALT continued to decline until finding further support at a shorter-termed downside 1.414 Fibonacci Extension level priced at $0.38. Over the past trading week, the market has been trapped bound within a range between the downsides 1.414 Fibonacci Extension at $0.38 and the 1.272 Fibonacci Extension priced at $0.52.
If the bulls can gather momentum within the market and break price action above the 1.272 Fibonacci Extension, we expect higher near-termed resistance to be located at the previous longer-termed 1.272 Fibonacci Extension (outlined in the previous chart) priced at $0.97. If the market can break above this level, it will leave price action free to make an attempt at the 100-day SMA once again which is currently hovering around the $1.50 handle.
Alternatively, if bearish price action persists and pushes the market below the lower boundary of the range at $0.38, we expect immediate support to be located at the psychological round number handles of $0.35, followed by $0.30. Further support located below this level can be found at the shorter-termed downside 1.618 Fibonacci Extension level priced at $0.19.
The technical indicators are currently heavily favoring the bears at this moment in time, as the RSI trades below the 50 handle. The recent ascension of the RSI towards the 50 handle could indicate that the bearish dominance is beginning to show signs of failure. If the RSI can make a sustained break above the 50 handle, this would indicate that the bulls are regaining control.
As the market is largely BTC-driven these days, let us continue to quickly analyze price action for SALT relative to BTC over the short term to highlight any potential support and resistance zones.
SALT/BTC – SHORT TERM – DAILY CHART
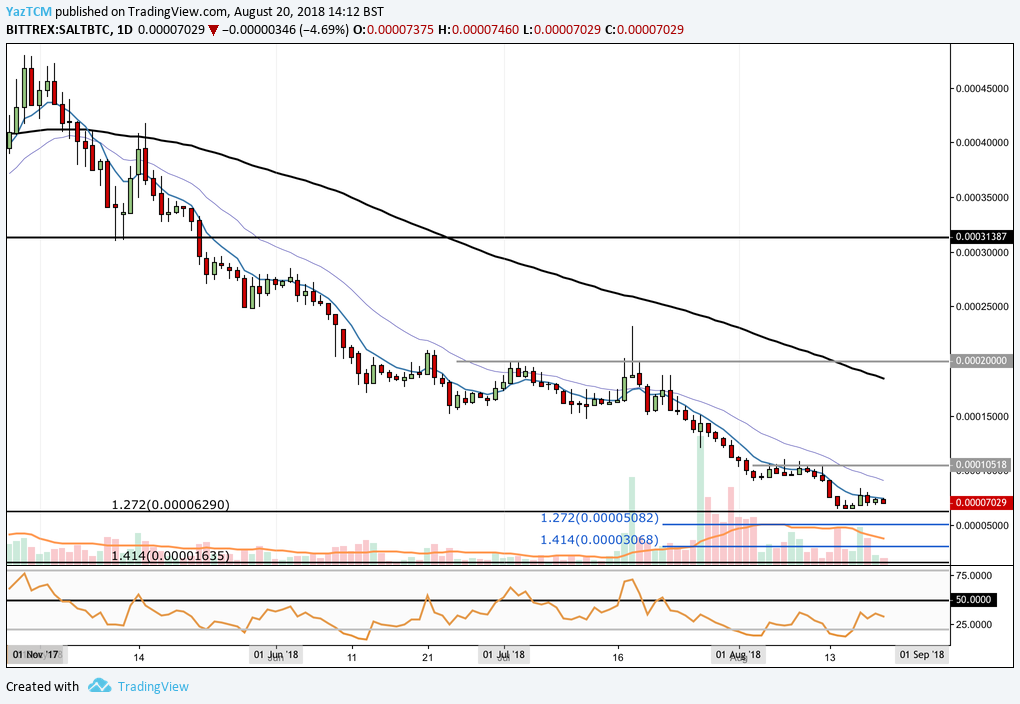
Analyzing the market from the short-term perspective above, we can see that SALT has experienced an extended price decline over the previous few months. Price action has recently found support at a downside 1.272 Fibonacci Extension level (drawn in black) priced at 6,290 SATS.
If the market can hold itself above this identified support level, we expect immediate resistance to be located around the 10,500 SATS handle. Further resistances above this level is expected at 20,000 SATS.
Alternatively, if price capitulation continues and pushes the market below the 6,290 SATS handle, we expect immediate support to be located at the shorter termed downside 1.272 Fibonacci Extension level (drawn in blue) priced at 5,082 SATS, followed by the 1.414 Fibonacci Extension priced at 3,068 SATS.
Related: Status Price Analysis: SNT 94% Down From ATH, Showing Signs Of Promising Support