
Cardano may have seen a sharp price fall – totaling over 14% throughout the past trading week – but with some very strong support below, some of the technical indicators are starting to suggest its getting close to the time to buy.
After seeing a 17% price hike over the past 30 trading days – with a further 86% price explosion over the past 3 months – Cardano is still certainly on the bullish footing.
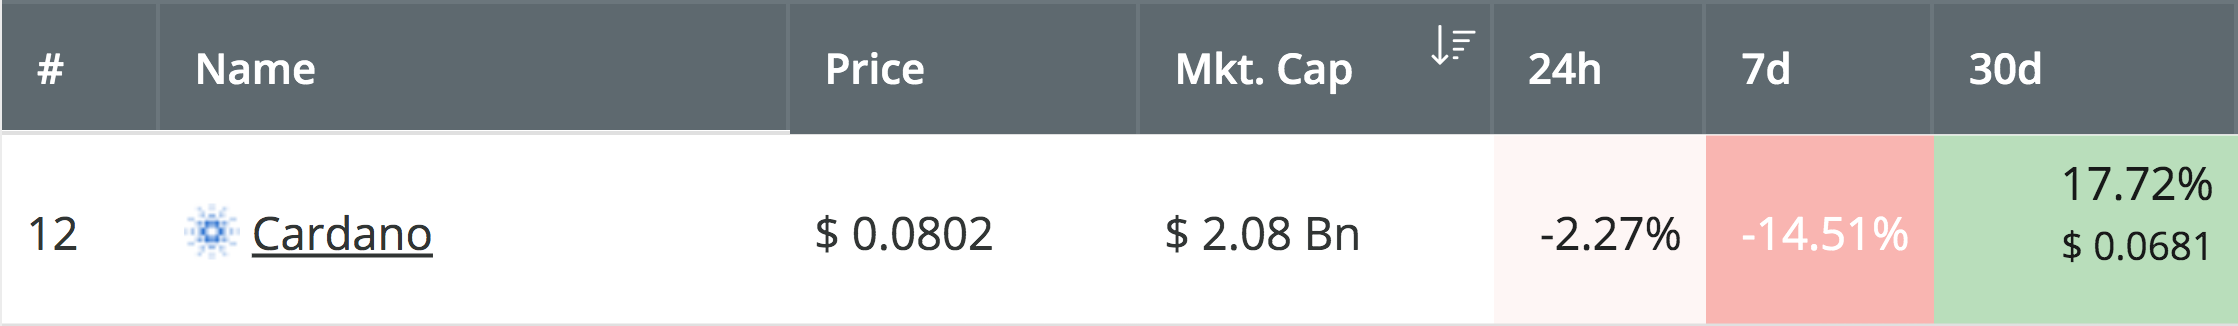
Source: CoinCheckup
The cryptocurrency had failed to make any ground above the $0.95 level during the start of June 2019 and proceeded to fall further lower. However, the cryptocurrency has now reached a decent level of support, and the Stochastic RSI is suggesting that the selling pressure may be coming to an end soon. With strong support beneath the market and the Stochastic RSI priming for a bullish crossover, this may be a fantastic time to purchase some ADA for the next bull run higher.
Cardano is currently ranked in the 12th place amongst the top cryptocurrency projects by market cap value, as it currently holds a $2.08 billion market cap. Let us continue to analyze the ADA/USD chart and highlight some areas of support beneath the market – and potential areas to buy – where a rebound may occur.
Cardano Price Analysis
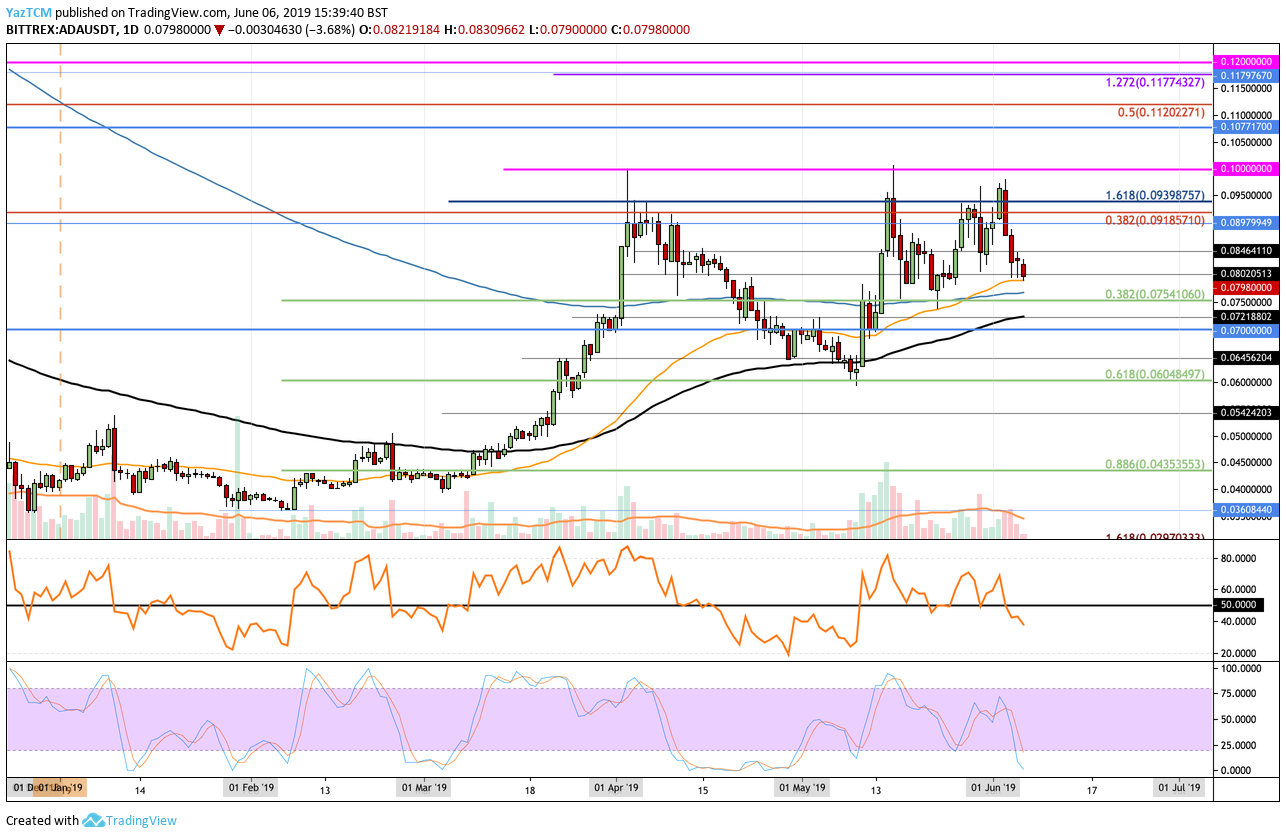
ADA/USD – MEDIUM TERM – DAILY CHART
What Has Been Going On?
Looking at the daily ADA/USD chart above, we can see that the market has fallen from above the $0.095 level to current support at the $$0.08 level. The current support is provided by the 50-day EMA.
What Are the Technical Indicators Showing?
The RSI has recently slipped beneath the 50 level, which suggests that the sellers have recently taken control of the market momentum. However, the Stochastic RSI has recently reached an extremely oversold area, which suggests that the current round of selling will be drawing to a close relatively soon.
How Far Can We Fall Before We Bounce?
As the Stochastic RSI has yet to produce a bullish crossover signal, it is still not quite the right time to buy. However, there are still some areas of strong support beneath the market where we can expect the rebound to occur.
If ADA/USD does indeed fall beneath the $0.080 support area, we can expect immediate support beneath the market to be located at the short-term .382 Fibonacci Retracement level (drawn in green), priced at $0.0754. This area of support is further bolstered by the 200-day moving average which is currently hovering around the same price area. This combined level of support should prove to be strong enough to cause the bearish pressure to reverse and allow ADA/USD to climb higher.
If ADA/USD does break further beneath $0.075, the next level of strong support is located at the $0.07210 level. This level of support is provided by the 100-day moving average. Beneath this, further support is then located at $0.07, $0.0645, and $0.060.
Conclusion
The Stochastic RSI has recently reached an overbought area and is primed to produce a bullish crossover signal in the next few days. However, as the Stochastic RSI has yet to produce the signal, we may see ADA slip further lower.
If ADA does drop beneath $0.08, we can look for support at the $0.075 and $0.070 levels to buy again.