
Bitcoin has now started to quieten down around the $8,700 level, after dropping a total of 1% over the past 24 hours of trading. Bitcoin is now currently trading around the $8,637 level, after reaching a high of $8,947 on May 27, 2019.

Source: CoinCheckup
However, despite the recent price stall, Bitcoin has seen a 9.3% price increase over the past 7 trading days, with a further 64% price surge over the past 30 trading days. Furthermore, over the past 90 trading days, Bitcoin has seen a 125% price explosion. With such a powerful parabolic move higher, it is no suprise that Bitcoin has stalled slightly. However, this moment in particular can be considered as the calm before the $10k storm.
Bitcoin currently holds a $153 billion market cap valuation, adding $58 billion to the valuation in May 2019 alone.
Let us continue to look ahead and highlight some areas of potential support and resistance moving forward.
Bitcoin Price Analysis
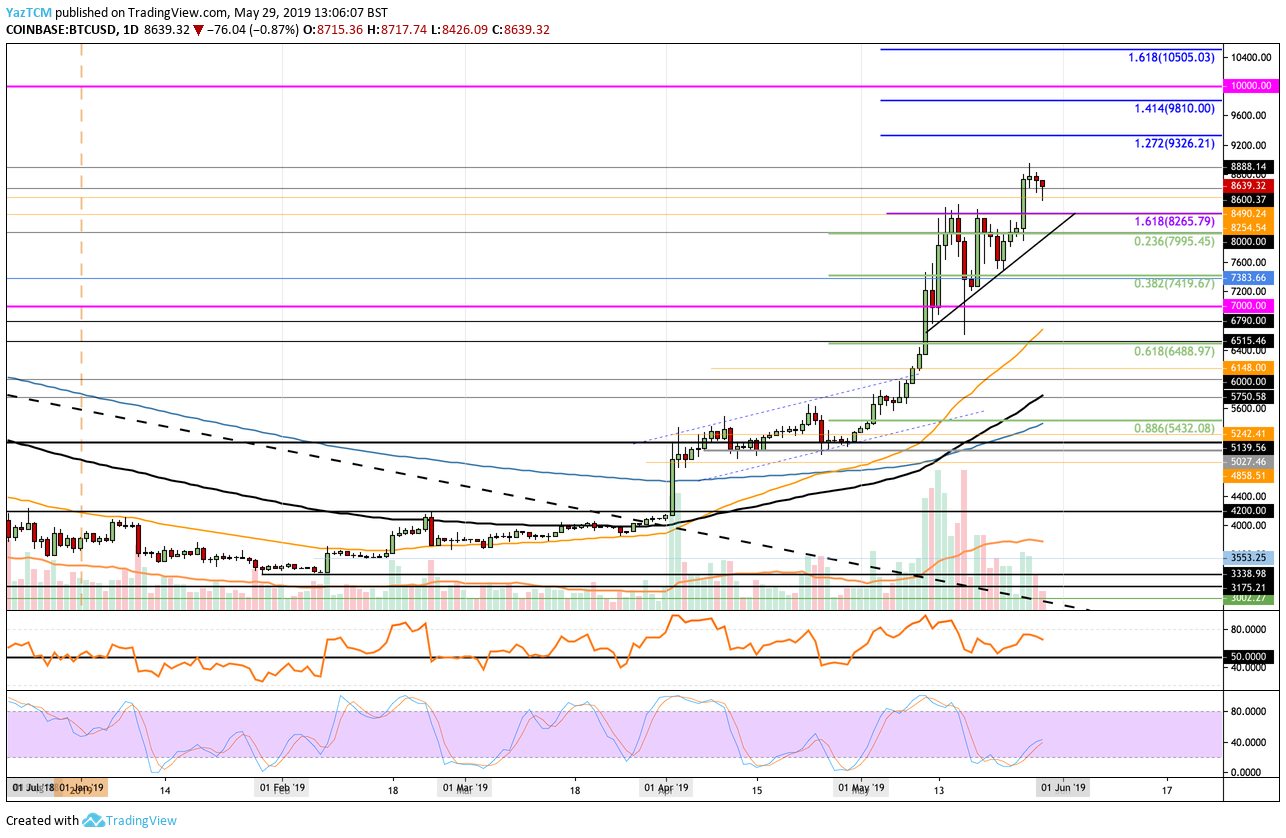
BTC/USD – MEDIUM TERM – DAILY CHART
What Has Been Going On?
Analyzing the daily BTC/USD chart above, we can clearly see the May 2019 price surge, starting from a low around $5,140 and rising to a high of $8,947. The cryptocurrency previously experienced some strong resistance during May at the short-term 1.618 Fibonacci Extension level (drawn in purple), priced at $8,265, causing price action to form a short-term ascending triangle.
The recent price surge has now allowed BTC/USD to break above the resistance at $8,265 as well as break above the upper boundary of the ascending triangle. Bitcoin was unable to close higher above $8,700, and has now dropped to where it is currently trading at around $8,639.
What Is the Current Trend?
The current trend for Bitcoin most certainly remains bullish in the short and long term. For this bullish trend to invalidated in the short term, we would need to see Bitcoin fall and drop beneath the $7,000 support level.
Where Is the Resistance Above $8,700?
If the buyers can continue to climb back above $8,700, we can expect immediate higher resistance above to be located at $8,800 and then at $8,888. Above this, further resistance can then be located at the $9,000 price level.
If the bulls can break above $9,000, we can then expect more resistance above to be located $9,100 and $9,200. Above this, further resistance is located at the medium-term 1.272 Fibonacci Extension level (drawn in blue), priced at $9,326. This is followed with resistance at $9,500 and then at the medium-term 1.414 Fibonacci Extension level (drawn in blue), priced at $9,810.
If the buyers can then clear the $9,900 level above $9,810, they will then be clear to make an attempt at the $10,000 target level. To reach $10,000, Bitcoin will need to increase by a total of 16% from the current price.
Further above $10,000, higher resistance can then be located at the 1.618 Fibonacci Extension level (drawn in blue), priced at $10,505.
Where Is the Support Beneath the Market?
If the selling pressure causes BTC/USD to drop beneath the current support around the $8,600 level, we can expect immediate support below to be located at $8,490 and then at $8,265. As the $8,265 level provided a strong level of resistance during May 2019, we can expect the price level to continue to provide strong support moving forward.
Beneath $8,265, further support then lies at $8,254, $8,100, $8,000, and $7,995. If the selling continues further beneath $7,996, further support toward the downside is expected at the short term .382 Fibonacci Retracement level (drawn in green), priced at $7,419 and then at $7,000.
What Are the Technical Indicators Showing?
The Stochastic RSI is in a promising position for the bulls as it sits in overbought territory and has produced a bullish crossover signal. If the Stochastic RSI can now continue to rise, we can expect BTC/USD to also increase its bullish pressure.
The RSI itself is currently pointing downward but remains in bullish territory. If the RSI can remain above 50 on the retracement we can expect Bitcoin to continue its way toward $10,000 after a rebound at lower support.
Conclusion
Bitcoin is most certainly on the way toward the $10,000 level. However, the market increase has stalled slightly over the past 3 days to give the bulls time to rest and gather their energy once again. Each time Bitcoin rises and creates a fresh 2019 high we can expect the market to stall as traders take profits off of the tables.
This is the quiet before the $10k storm. Once Bitcoin clears the $8,888 region and $9,000, the $10k level will be an unstoppable target to reach.