- The year-long downtrend for Lisk reached a turning point in August 2018 when price action reached support at $2.61.
- Price action is now struggling to break above $3.00 but strong support is close below.
- Support Moving Forward: $2.70, $2.61, $2.50, $2.00, $1.55.
- Resistance Moving Forward: $3.01, $3.51, $3.87, $4.27, $4.84, $5.43, $5.95, $6.28, $6.72, $7.34.
Lisk has witnessed a small price decline over the previous 24 hours against the US Dollar which totals 2.91%. On exchanges, LSK/USD is trading at around $2.91, at the time of writing, after experiencing a stable 7-day period where price action increased a slight 1%.
The crypto project dedicated to making blockchain development more accessible is now ranked in 29th position in terms of overall market cap. It currently holds a $325 million market cap value after a 90-day period of adversity as the market drops a lofty 40%. The 31-month old project is now trading at a price that is 92% lower than its all-time high (ATH) value.
Let us continue to analyze price action for LSK over the long term and inspect market behavior.
Lisk Price Analysis
LSK/USD – LONG TERM – DAILY CHART
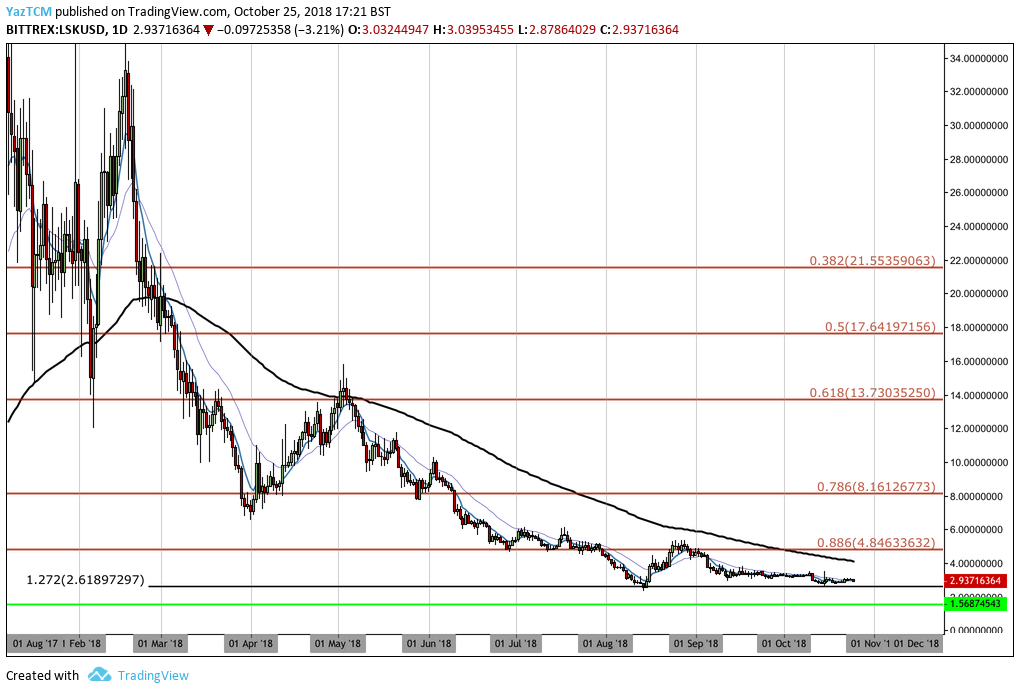
Analysing market action from the long-term outlook above, we can instantly recognize the turbulent year for LSK/USD. The market has consistently dropped since placing its ATH value of $41.39 on January 7, 2018.
The market has seen some form of support recently as it hit a long-term downside 1.272 Fibonacci Extension level (drawn in black) priced at $2.6189. As price action arrived at this support level, the bears ceased with their downward momentum,. allowing the bulls to create a price rebound.
The LSK/USD market has been relatively stable since arriving at this support level. It continued to trade sideways for the next few weeks.
Let us proceed to inspect price action for LSK/USD a little closer over the shorter period and highlight any potential support and resistance areas within the market.
LSK/USD – SHORT TERM – DAILY CHART
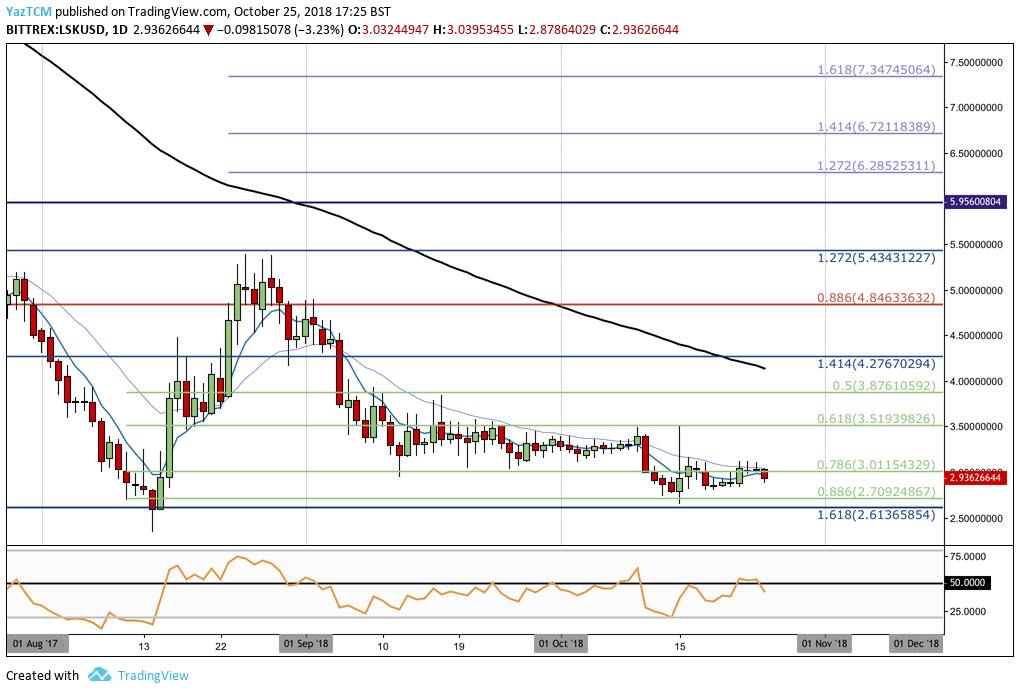
Looking at the market from the shorter time horizon above, we immediately notice that the support at the long-term downside 1.272 Fibonacci Extension level was further bolstered by another shorter-term downside 1.618 Fibonacci Extension level (drawn in blue) priced at $2.6136.
This combined area of support allowed price action to reverse its previous downtrend and proceed to rally.
We can see that the market underwent a bullish rally when price action began at a low of $2.34 on August 14, 2018 and extended to a high at $5.39 on August 25, 2018. This created a bullish price increase which totaled 128% from low to high.
We can see that the high was met with resistance at a downside short-term 1.272 Fibonacci Extension level (drawn in blue) priced at $5.43.
The market has since rolled over and decreased. It had originally found a strong form of support at the short-term .786 Fibonacci Retracement level (drawn in green) priced at $3.01 during September 2018. However, the bears continued with their pressure in October 2018. They penetrated price action below the support at $3.01, until further support below was found at the short-term .886 Fibonacci Retracement level (drawn in green) priced at $2.70.
Moving forward, if the bears continue with their downward pressure, we can expect immediate support below at the short-term .886 Fibonacci Retracement level (drawn in green) priced at $2.70. If the bears continue to break below this support, we can expect more support closely below at the previous downside 1.618 Fibonacci Extension level (drawn in blue) priced at $2.61.
A break below $2.61 will likely see the LSK/USD market head further lower toward support at the psychological round number handle at $2.50.
On the other hand, if the bulls restore their momentum and push price action above resistance at the $3.01 handle, we can expect immediate resistance higher to be located at the .618 and .5 short term Fibonacci Retracement levels (drawn in green), priced at $3.51 and $3.78, respectively.
If the bulls continue with their upward pressure, we can expect more resistance above to be located at the previous downside 1.414 Fibonacci Extension level priced at $4.27 followed by the long-term .886 Fibonacci Retracement level (drawn in red) priced at $4.84.
In the event that the bulls can persist to push the market above the $5.50 handle, further resistance down the line can be expected at the 1.272 and 1.618 Fibonacci Extension levels (drawn in purple), priced at $6.28 and $7.34 respectively.
The RSI technical indicator has recently shifted into the favor of the bears; it breaks below the 50 handle to indicate that the bears are in control of the momentum. If we would like to see some positive price action, we would need to see the RSI break back above the 50 handle.
Let us continue to analyze Lisk in relation to Bitcoin over the long term and highlight any potential support and resistance levels.
LSK/BTC – LONG TERM – DAILY CHART
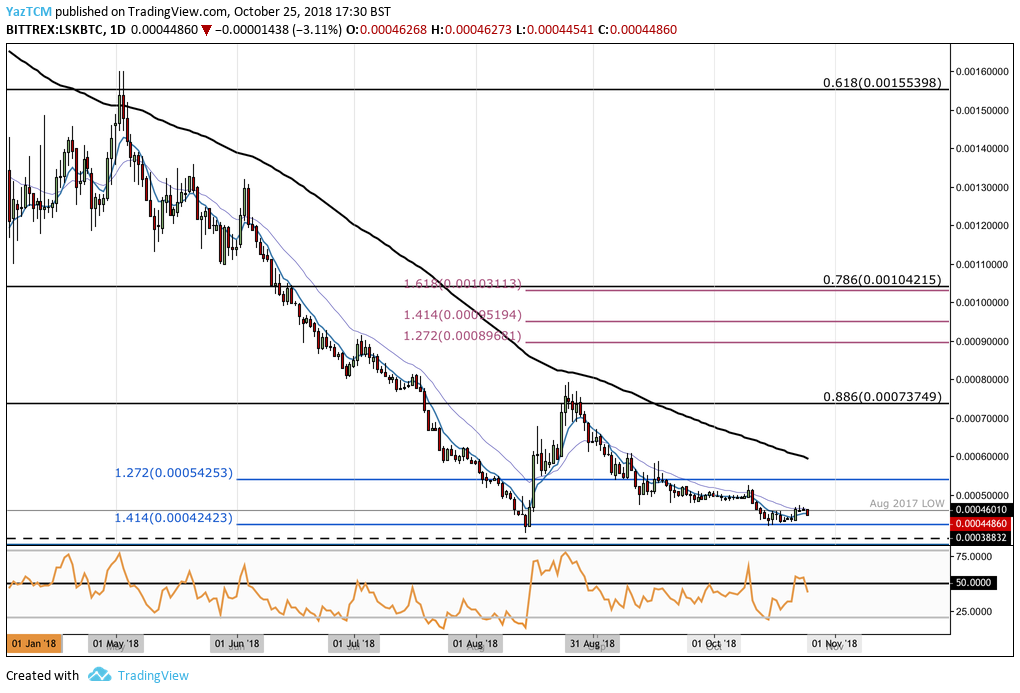
Taking a look at the long-term overview above, we can immediately notice the strong downtrend between May 2018 and August 2018.
The downtrend came to a halt when LSK/BTC arrived at a downside 1.414 Fibonacci Extension level priced at 42,423 SATS. This level of support proved strong enough to reverse the previous downtrend, allowing price action to rally.
The market is now trading very close to the previous support at 42,423 SATS as it hovers around 44,860 SATS. If the market continues lower, the support at 42,423 SATS will be a crucial level for the bulls to defend.
If price action falls below support at 42,423 SATS, then we can expect further lower support to be located at the 38,832 SATS handle.
Alternatively, if the bulls can regroup and push LSK/BTC above resistance at 46,000 SATS, then we can expect further resistance higher to be located at the previous 1.272 downside Fibonacci Extension level, priced at 54,253 SATS. If the bullish momentum continues higher, more resistance above can be expected at the 100-day moving average which presently hovers around the 60,000 SATS handle.
If the bulls can move further higher and penetrate above resistance at the August 2018 high priced at $5.39, further resistance above can be expected at the 1.272 and 1.618 Fibonacci Extension levels (drawn in purple), priced at 89,681 SATS and 101,113 SATS respectively.
Similarly, the RSI is providing favor to the bears in this market as well. For a bullish press, we would need to see the RSI break above the 50 handle to indicate that the bulls are in control of the momentum within the market.