
Ripple has seen a small price increase over the past 24 hours totaling 4.54%, allowing the cryptocurrency to climb above the $0.46 level. Ripple has seen a 24% price rise over the past week, with a further 56% price surge over the past 30 days.
Ripple is now ranked in 3rd position, as it currently holds a $19.56 billion market cap valuation.

Source: CoinCheckup
With the recent price increases in the Ripple market, the cryptocurrency continues to edge its way near the $0.50 level. In this article, we will take a look at the resistance above the market for Ripple to overcome before being able to reach the $0.50 level.
For the entire period of 2019, Ripple has been struggling heavily against Bitcoin, falling by a total of 60% from high to low. However, Ripple has recently rebounded against Bitcoin, allowing XRP/BTC to climb back above the 5,000 SAT level. If XRP/BTC can continue to climb further higher, we can certainly expect XRP/USD to reach the $0.50 level in no time at all.
Let us continue to take a look at the XRP/USD market and highlight some potential areas of support and resistance moving forward.
Ripple Price Analysis
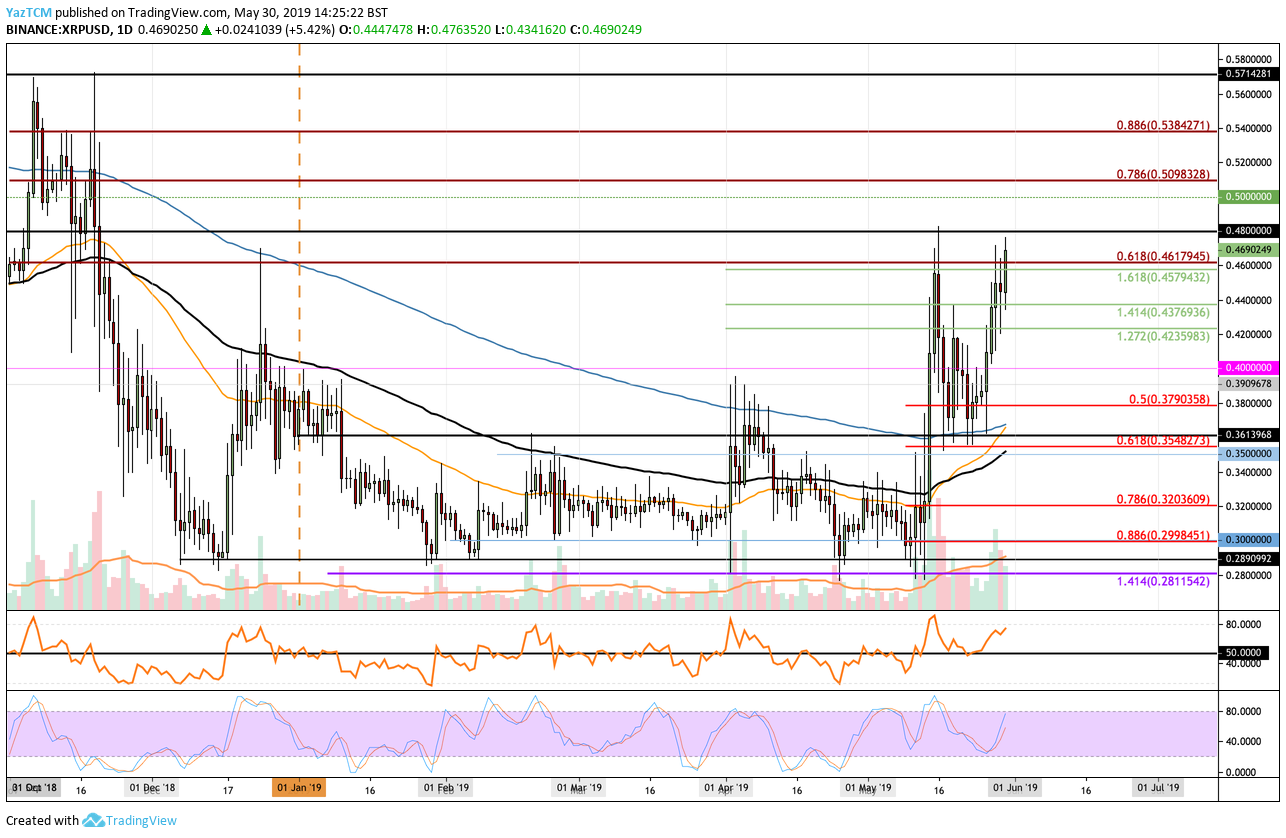
XRP/USD – MEDIUM TERM – DAILY CHART
What Has Been Going On?
Analyzing XRP/USD from the daily chart above, we can see that Ripple recently rebounded from support at the 200-day moving average around the $0.36 level. After bouncing from this level of support, Ripple went on to climb further higher, and has just climbed above heavy resistance at the bearish .618 Fibonacci Retracement level (drawn in red), priced at $0.4617.
What Is the Current Trend?
The current trend for Ripple is now considered to be bullish with the recent break above $0.46. However, we must wait for a close above $0.46 for this to be confirmed. If Ripple was to fall and drop beneath the support at the $0.36 level, we could consider the market to have re-entered a short-term bearish trend again.
How Far Away Is $0.5?
In all honesty, $0.5 is not too far away, but Ripple will need to clear and close above the $0.46 level to make any movement higher toward $0.5.
If the buyers continue to cause Ripple to rise further higher, the next level of resistance for Ripple to overcome is located at the $0.48 level. If the bulls can clear this level, then there is not much significant resistance on the way toward $0.50.
If the bullish pressure continues to drive Ripple further above the $0.50 level, we can then expect further higher resistance above to be located at the bearish .786 and .886 Fibonacci Retracement levels (drawn in red), priced at $0.5098 and $0.5384, respectively. This bearish Fibonacci Retracement level is measured from the November 2018 high to the December 2018 price low.
Above this, the final levels of resistance to highlight are located at $0.55, $0.5714, and $0.58.
What If the Sellers Regain Control?
Alternatively, if the sellers regroup and begin to push the market lower, we can expect immediate strong support toward the downside to be located between $0.4617 and $0.4579. Beneath this, further support then lies at $0.4376, $0.4235, $0.42, and $0.40.
If the selling continues beneath $0.40, further support toward the downside is then expected at $0.3909, $0.3790, and $0.3548.
What Are the Technical Indicators Showing?
The Stochastic RSI has recently provided a bullish crossover signal in oversold territory, which has resulted in a bullish push higher. If the Stochastic RSI can continue to rise higher, we can expect the bullish run to continue. Furthermore, the RSI itself has bounced from the 50 level to indicate that the buyers are in full control of the market momentum.
Conclusion
Ripple has been struggling with the resistance between $0.44 and $0.46 for the entire period of May 2019. However, if the recent break above can result in a close above the resistance level, we can expect Ripple to continue to progress further higher toward the $0.50 level. The only level of significant resistance above $0.46 lies at $0.48 before $0.50.