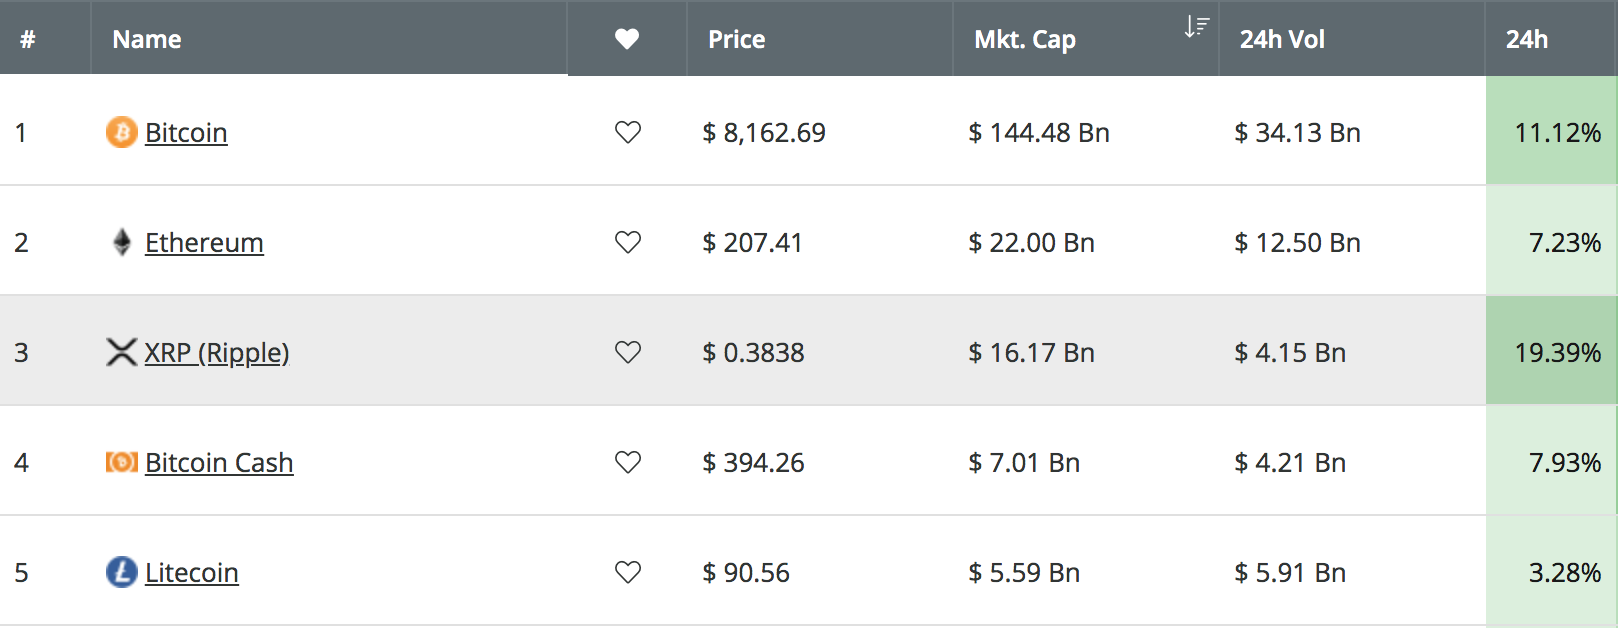
After an extended period of stagnant price growth, Ripple has finally managed to see some positive price action over the past 24 hours, with gains totaling around +19.39%. The cryptocurrency has now sailed above the $0.40 price level, and has even recorded higher gains than Bitcoin has today;
We previously wrote an article suggesting that this might be your last opportunity to buy cheap Ripple, and it’s beginning to look like we were correct. The recent Ripple price growth was helped with Ripple rebounding against Bitcoin over the past 24 hours after reaching support at the 4,000 SAT region. Ripple has been consistently falling, rather aggressively, against Bitcoin over the entire year. Since the start of 2019, Ripple has fallen by a total of 58% against Bitcoin, after starting the year at a high above 10,000 SATS.
Ripple remains ranked in 3rd position in the market cap rankings, as it presently holds a $16.17 billion market cap value. The cryptocurrency has managed to close the gap between second place holder, Ethereum, as it now presently sits $5.83 billion behind.
In this article, we will highlight some of the resistance levels that XRP/USD will need to overcome before being able to reach the target area at the $0.50 area.
Ripple Price Analysis
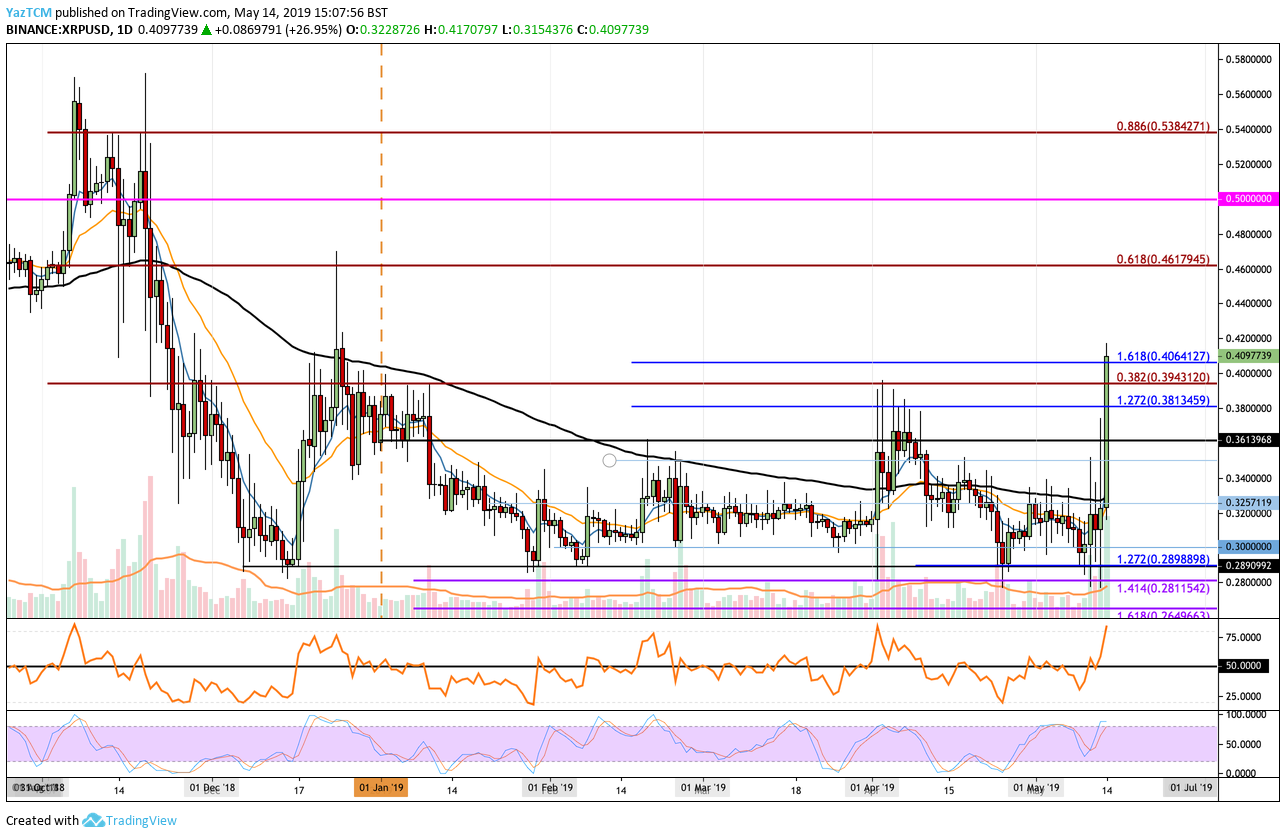
XRP/USD – MEDIUM TERM – DAILY CHART
What Has Been Going On?
Taking a look at the XRP/USD daily chart above, we can see that the recent price growth has now allowed XRP/USD to surge significantly higher above the 100-day moving average level. The price rise also managed to break above resistance at $0.36, $0.38, and $0.3943. The resistance at $0.03943 is particularly strong, as it is the bearish .382 Fibonacci Retracement level (drawn in red), which is measured from the November 2018 high to the December 2018 low.
Price action has risen above this aforementioned resistance and is now trading at higher resistance provided by a 1.618 Fibonacci Extension level (drawn in blue), priced at $0.0406.
What Is the Short-Term Trend?
After over 5 months of sideways, stagnant price action, the XRP/USD market has finally been able to reverse the price slump. The recent surge above the 100-day moving average level and the break above $0.38 has now rendered the XRP/USD market as bullish. For the bullish trend to become invalidated, we would need to see XRP/USD fall and break below the support at the $0.34 level.
Where Is the Support On the Way Toward $0.50?
If the bullish pressure continues further higher, we can expect immediate resistance above the market to be located at $0.42 and $0.44. Higher resistance above $0.44 is then located at the bearish .618 Fibonacci Retracement level (drawn in red), priced at $0.4617. This area of resistance is deemed to be strong, as it is the Fibonacci Golden Retracement level as well as the April 2018 strong support (now turned to resistance) level.
If the buyers can continue to climb further higher, they will need to clear higher resistance at $0.48 and $0.49 before being clear to make an attempt at the target price at $0.50.
Above $0.50, further higher resistance can then be located at $0.52 and $0.5384, which is resistance provided by the bearish .886 Fibonacci Retracement level (drawn in red).
What If the Sellers Resume Control?
Alternatively, if the sellers regroup and begin to push the market lower, we can expect immediate support toward the downside to be located at $0.40. Beneath $0.40, further support below is expected at $0.3943, $0.3813, $0.3615, $0.34, and $0.32.
What Are the Technical Indicators Showing?
Price action has recently been able to climb above the 100-day moving average level, which is an incredibly potent signal, especially if XRP/USD can stay above. Furthermore, the RSI has exploded above the 50 level for the first time since April 2019, which indicates that the buyers are in complete control of the market momentum.
If the RSI can remain above 50, we can expect XRP/USD to continue to climb higher toward $0.50.
Conclusion
The recent price growth witnessed by XRP/USD has now taken the market out of the 5-month sideways price action slump where it has been trapped. The recent turnaround in XRP/BTC has greatly helped Ripple break back above the 100-day moving average and head toward the $0.40 level. If the XRP/BTC reversal continues higher, we can expect XRP/USD hitting the $0.50 within the next week or two.