
Bitcoin has seen a remarkable run over the previous 90 trading days after rising by over 100% and breaking above the $8,000 level. However, Bitcoin has since fallen slightly by around 2.54% over the past 7 trading days, and is now currently trading at $7,737.
The recent stall in Bitcoin’s price climb has also caused other top-flight cryptocurrencies to pull back, even harder in some cases. Over the past 7 trading days, Ethereum has dropped by a total of 5.96%, bringing the price down to around $243, and Ripple has dropped by a steep 11%, bringing the price down to around $0.3750.
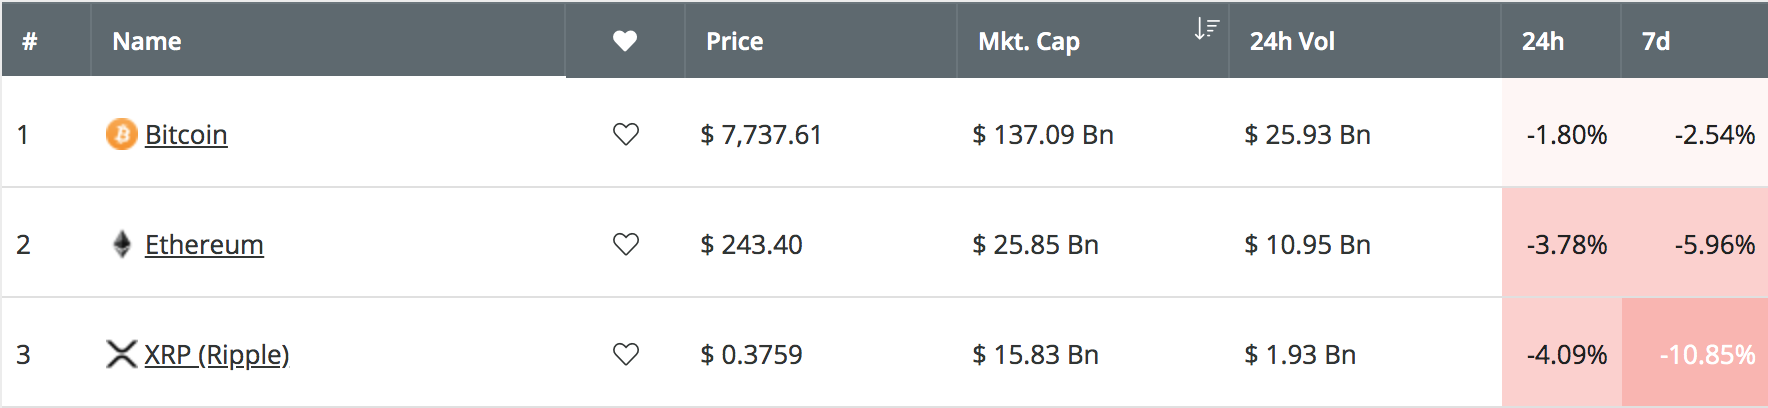
Source: CoinCheckup
Despite the recent price drops, both Ethereum and Ripple are showing some indications that this current short round of selling has started to fade. Ripple is currently holding the support at the 200-day moving average level very well, and the Stochastic RSI for Ethereum suggests that a reversal of this short-term downtrend could occur over the next few days.
Let us take a look at both the Ethereum and Ripple markets and highlight some potential areas of support moving forward.
Ethereum Price Analysis
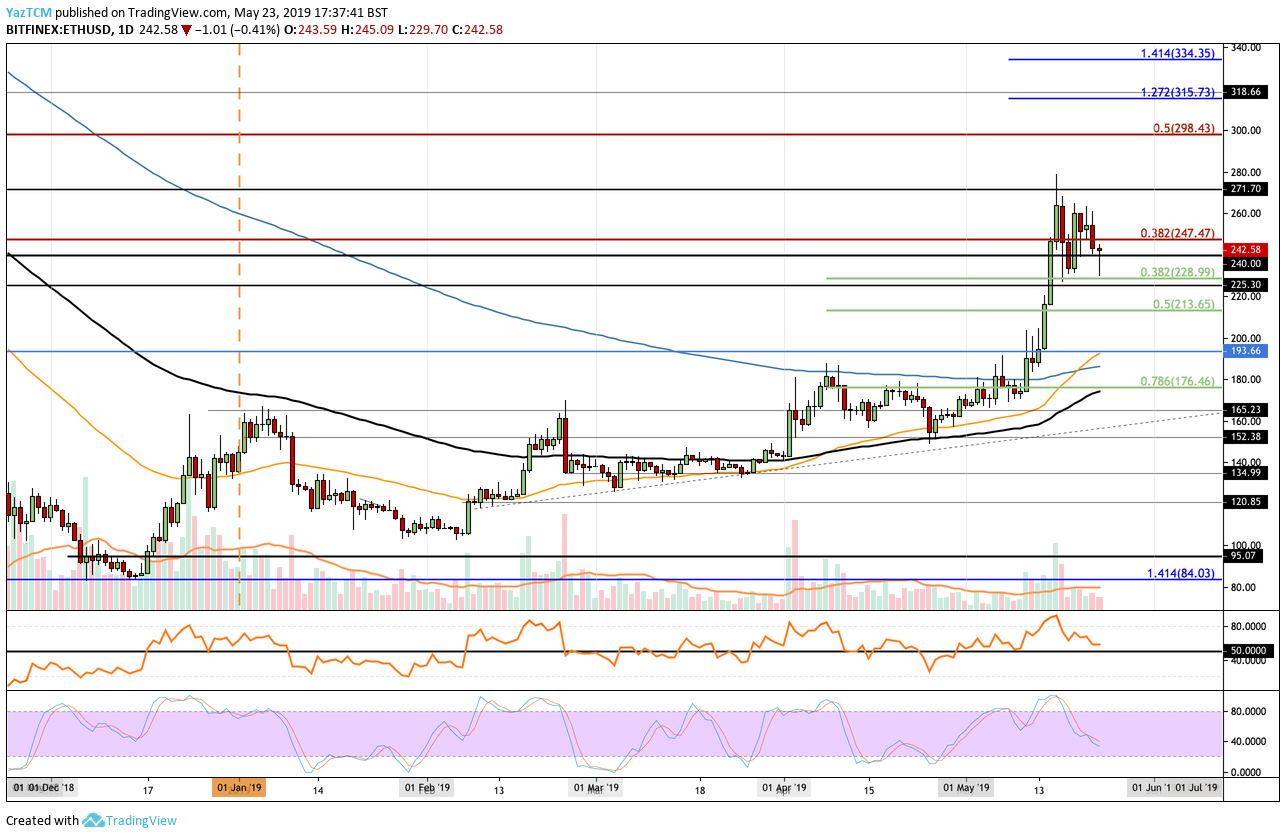
ETH/USD – MEDIUM TERM – DAILY CHART
What Has Been Going On?
Taking a look at the ETH/USD daily chart above, we can see that Ethereum met strong resistance around the $270 level and reversed. The cryptocurrency went on to fall into support around the short-term .382 Fibonacci Retracement level (drawn in green), priced at $228, and rebounded higher. Ethereum is now trading at the $242 level as the period of consolidation continues.
The technical indicators are suggesting that the previous round of selling may be finishing soon as the Stochastic RSI approaches oversold conditions. Furthermore, during this most recent retracement, the RSI for Ethereum has managed to remain above the 50 level, which indicates that, although the previous buying pressure is diminishing, the sellers still are not in control of the market momentum.
Where Is the Support Beneath the Market?
As the Stochastic RSI has not quite reached oversold conditions just yet, we can expect the market drop to continue further lower still. In this case, If ETH/USD drops beneath the $240 level, we can expect immediate support beneath to be located at the $228 support level.
If price action continues beneath $228, further support is then located at the short-term .5 Fibonacci Retracement level (drawn in green), priced at $213. This is followed up with stronger support at the $200 level.
Where Can We Rebound?
If the selling continues to drop price action beneath the support at $228, we can expect the rebound at $200. Otherwise, if Bitcoin can continue its climb once again, we can expect ETH/USD to hold this support and bounce around $228.
When ETH/USD does bounce higher, we can expect immediate strong resistance above the market to be located at the long-term bearish .382 Fibonacci Retracement level (drawn in red), priced at $247. This bearish Fibonacci Retracement is measured from the July 2018 high to the December 2018 low.
If the buying continues above $250, further higher resistance can be located at $271, $280, and then the bearish .5 Fibonacci Retracement level (drawn in red), priced at $298.
Ripple Price Analysis
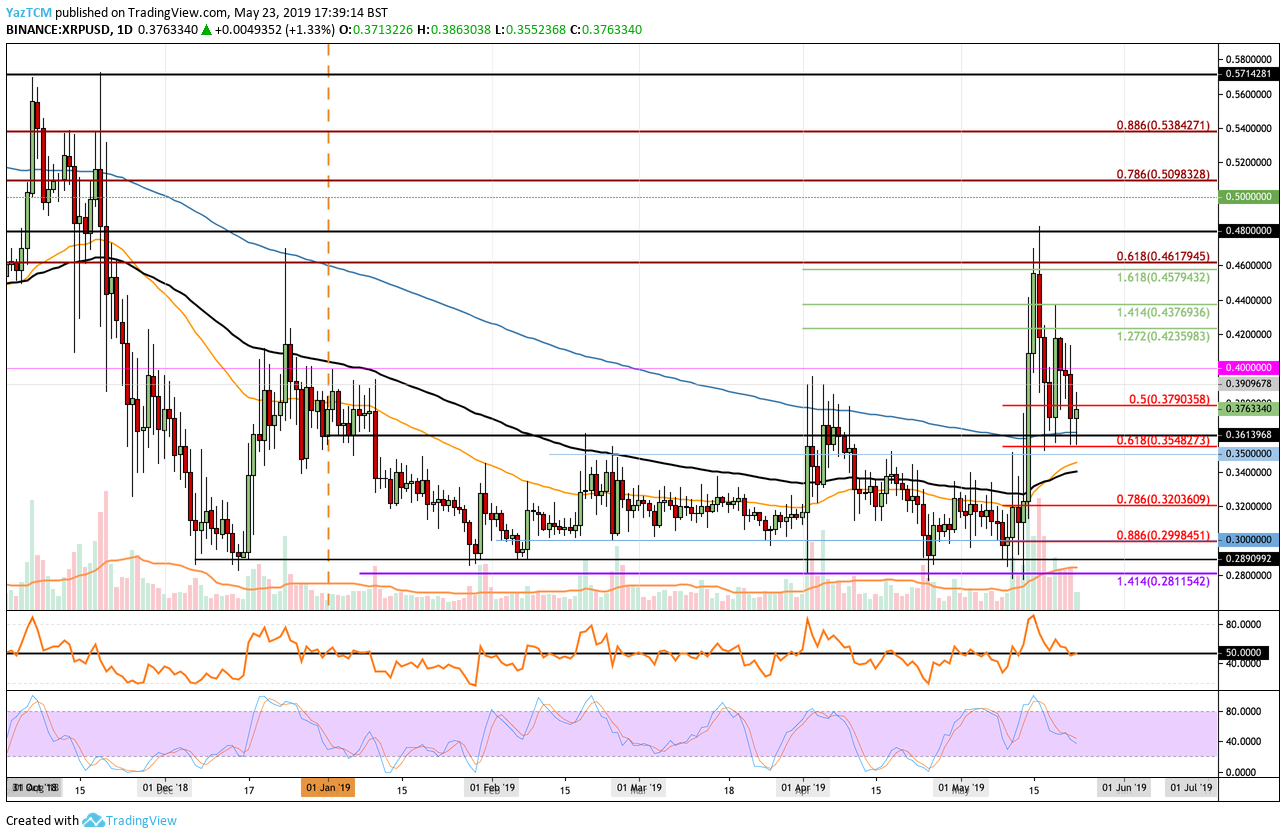
XRP/USD – MEDIUM TERM – DAILY CHART
What Has Been Going On?
Analyzing the daily chart for Ripple above, we can see that the market had experienced a very stagnant year until mid-May 2019 where price action soared above $0.32 to reach a high around $0.48.
The recent price surge during May allowed Ripple to break out of its previous sideways movement and head above the 200-day EMA for the first time since November 2018.
We can see that Ripple has pulled back slightly from the high around $0.48 and is now trading at support around the $0.37 level. We can also see that during the recent price decline, Ripple has managed to remain above the 200-day moving average, which is a very promising signal.
Where Is the Support Beneath the Market?
The strongest level of support beneath the current price is located directly at the 200-day moving average, which is located at $0.3615. Beneath this, further support can then be expected at the short-term .618 Fibonacci Retracement level (drawn in red), priced at $0.3548 and then at $0.35.
If the selling continues beneath $0.35, further support below is expected at $0.34, $0.32, and $0.30.
Where Is the Resistance?
Alternatively, if the buyers can defend the support at the 200-day moving average level and head further higher, we can expect immediate resistance above the market to be located at $0.3790, $0.39, and $0.40.
Further above $0.40, more resistance is then located at $0.4235, $0.4376, and then at the bearish .618 Fibonacci Retracement level (drawn in red), priced at $0.4617. This level provided significant resistance during May, and if price action can break above here it would create a fresh 2019 high.
Above $0.4617, further resistance is located at $0.48 and $0.50.
Conclusion
Although Ethereum and Ripple may have taken a small beating over the past week, the period of consolidation is necessary. If Ethereum can remain above $228/$200 and Ripple can hold at the 200-day EMA during the Bitcoin consolidation period, we can expect both cryptocurrencies to soar after Bitcoin breaks higher to create fresh 2019 highs all around.