
- Monero has created a fresh yearly low today at around $40.58.
- The market has rebounded slightly, and is trading above support at the $41.82 handle.
- Support moving forward: $41.82, $40, $34.44, $30, $25.22, $20.
- Resistance moving forward: $44.36, $50, $53.38, $58.22, $69.21, $78.09, $86.97.
Latest Monero News
Around 90% of XMR have already been mined before the Monero “tail emission” kicks in. The tail emission is a system within the Monero network that gradually brings the block reward for miners down to around 0.6 XMR.
The tail emission is slightly similar to BTC’s block halving, which occurs around every 4 years.
However, the Monero team has elected for a diminishing block reward after each block that’s been mined. This means that after each block has been found, the block reward decreases each time by a small fraction.
Currently the block reward is around 3.44 XMR ,and this will gradually decrease until the tail emission when the block reward will be 0.6 XMR.
For a comparison between the BTC block halving and the XMR tail emission, you can consult this spreadsheet, which outlines the rewards for each blockchain on a daily basis.
The tail emission is set to take place around the year 2022. This, alongside the small miner’s fee, has been put in place to incentivize miners to continue to mine after the totaly supply of 18.4 million XMR is reached. The small tail emission will continue to provide incentive to miners, at the expense of a small inflation in Monero. However, the inflation should also account for lost and forgotten coins throughout the years.
In Monero news, the exchange and ATM company, Bity, has announced that it will be adding Monero to their services. This will allow the privacy-focused cryptocurrency to be bought with cash (CHF or EUR) at their ATMs across Switzerland, further increasing the accessibility of the cryptocurrency.
Let us continue to take a look at the XMR/USD market and highlight any areas of significant support and resistance moving forward.
XMR Price Analysis
Over the past 24 hours of trading, the XMR cryptocurrency has fallen by a small 1.07%, bringing the current trading price to around $42.84.
XMR/USD has seen a rather muted 6.21% price decline over the past 7 trading days, relative to the rest of the top cryptocurrencies, but has seen a significant 59% price collapse over the past 30 trading days.
Monero is now ranked in 12th position and retains a total market cap value of $704 million. The 55-month old project has fallen a significant 91% in value since placing the all-time high in the market earlier this year.
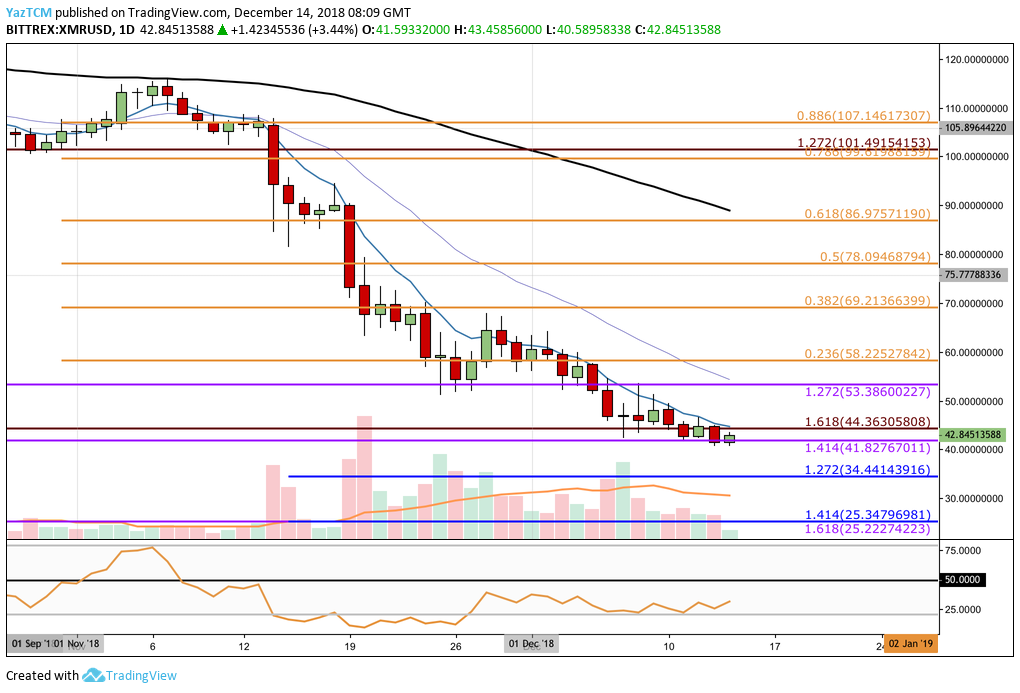
Looking the short-term price chart above, we can clearly see the November price collapse being represented by the severe fall of XMR from a high above $110 to a low around $53 which was reached toward the end of November 2018.
The November low had met support at a medium-term downside 1.272 FIbonacci Extension level (drawn in purple) priced at $53.38.
However, as December 2018 began to trade, price action dropped further to find support beneath at the medium-term downside 1.414 FIbonacci Extension level (drawn in purple) priced at $41.82.
We can see that the market has recently rebounded slightly from this support level in today’s trading session (December 14).
Trend: Bearish
The XMR market has consistently continued to create lower lows throughout the past few weeks, and had placed a fresh low for the year 2018 today at a price of $40.58.
As the market continues to make lower lows, the market is deemed to be bearish.
For a bullish trend to occur, we would need to see the buyers push price action higher and break above the $70 handle to indicate the start of a bullish reversal trend.
Where is the Support Located for XMR Below the $40 Handle?
If price action for XMR/USD continues to drop further and breaks beneath the support at $40, we can expect immediate support beneath to be located at the short-term downside 1.272 FIbonacci Extension level (drawn in blue) priced at $34.44.
Further support below this can then be expected at the psychological support provided at $30.
If the sellers continue to penetrate below the $30 handle, we can expect more support beneath to be located at the combined support area provided by the medium-term downside 1.618 Fibonacci Extension level (drawn in purple) priced at $25.22.
Where Will the Buyers Meet Resistance If They Push XMR Higher?
If the bulls manage to begin to push XMR price action higher, immediate resistance is located closely at the previous long-term downside 1.618 FIbonacci Extension level (drawn in red) priced at $44.36, followed by added resistance at the round number level at $50.
If the buyers can continue to climb above the $50 handle, we can then expect more resistance above to be located at the previous medium-term downside 1.272 Fibonacci Extension level (drawn in purple) priced at $53.38.
Further resistance above can ,be located at the bearish .382 and .5 Fibonacci Retracement levels (drawn in orange) priced at $69.21 and $78.09 respectively.
Conclusion
The entire cryptocurrency industry is in a fragile position at this moment in time, largely dictated by the drops seen within the Bitcoin market.
If Bitcoin continues to fall below the $3,000 handle, we can expect XMR/USD to continue to fall further and continue to create fresh yearly lows.