
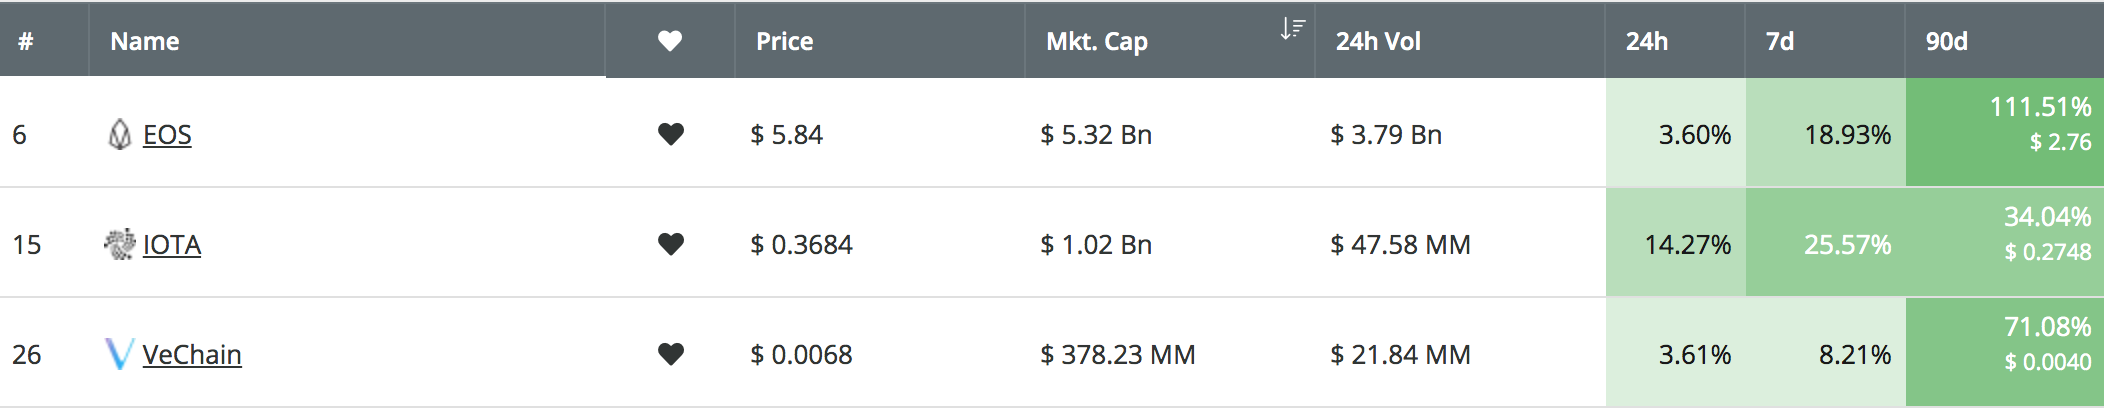
Cryptocurrencies have been on an epic tear over the last few days as Bitcoin has helped a lot of coins to soar. Projects such as EOS and IOTA have seen modest gains of 19% and 25% respectively over the past 7 days. VeChain has even seen an 8% price hike over the 7 days, which extends to an enormous increase of 71% over the past 90 trading days.
Let us take a look at the markets for each of these coins and see where they could potentially head toward next.
VeChain Price Analysis
What Has Been Going On?
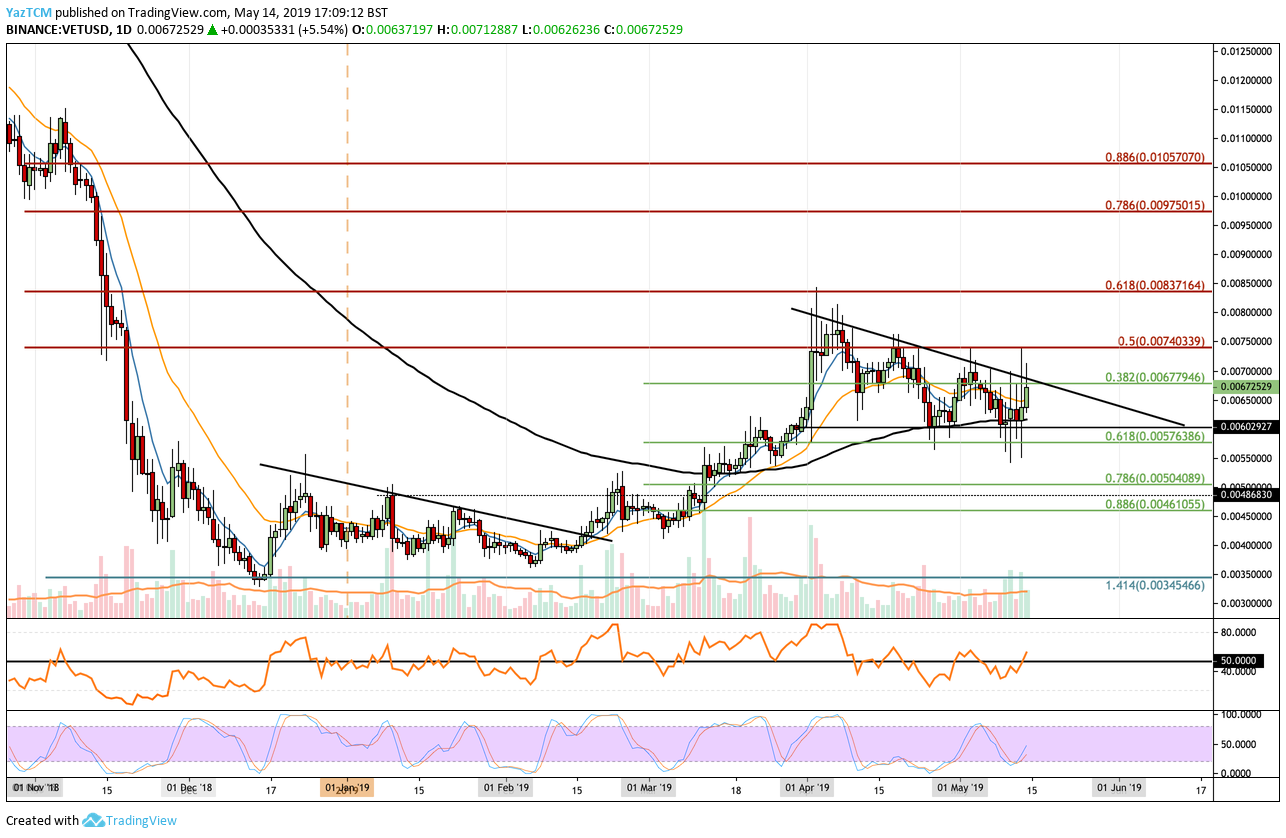
VeChain saw a great bullish press higher during March 2019 when it managed to break above the 100-day moving average and continued to climb higher into resistance at the $0.00837 level. This area of resistance was provided by a bearish .618 Fibonacci Retracement level (drawn in red), measured from the November 2018 high to the December 2018 low.
After reversing at this high, we can see that VET/USD proceeded to fall and trade sideways within a descending wedge formation. The base of the descending wedge is priced at $0.0060, which is also further supported by the 100-day moving average level. The VET/USD market has been trading within the confines of this descending wedge formation since the start of April 2019.
Can VeChain Hit $0.00837?
VET/USD is currently trading at resistance provided by the upper boundary of the wedge formation. If the bullish pressure can cause the market to break above the wedge, we can expect immediate resistance higher to be located at the bearish .5 Fibonacci Retracement level (drawn in red), priced at $0.0074.
If the buyers continue to push above this resistance, higher resistance is located at the bearish .618 Fibonacci Retracement level (drawn in red), priced at $0.00837. This is the April 2019 high, and we can expect VeChain to at least reach this level next, before the end of May 2019.
Above $0.00837, further resistance can be located at $0.009, $0.0095, and the .786 Fibonacci Retracement level priced at $0.00975.
Alternatively, if the sellers regroup and push the market lower, we can expect strong support at the lower boundary of the wedge. Beneath the wedge, further support lies at $0.0057, $0.0055, and $0.0050.
IOTA Price Analysis
What Has Been Going On?
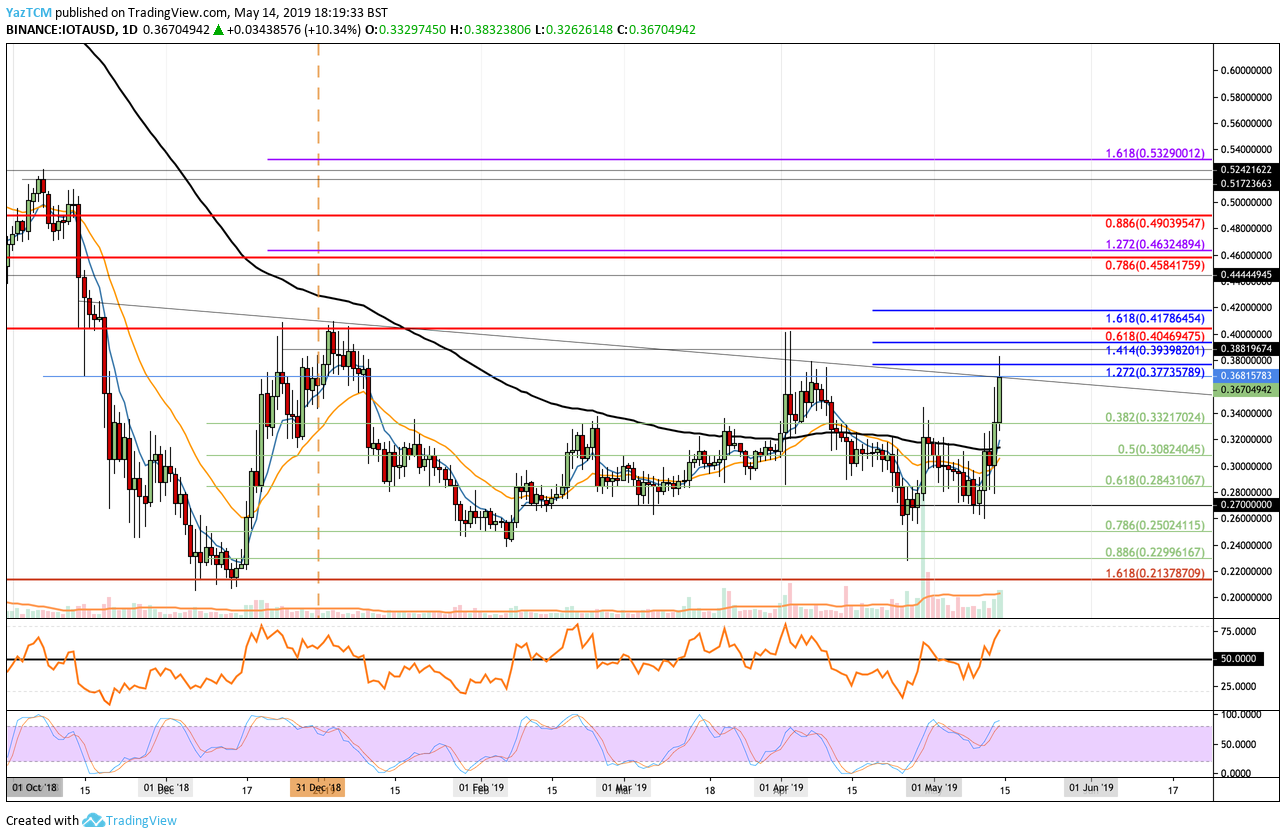
IOTA exploded in price growth today with an increase of 14%. The recent increase has allowed IOTA to rise above the $0.34 level to where it is currently trading at resistance around $0.3681. This price level provided strong resistance for the market during April 2019 and therefore should provide strong resistance moving forward.
Nevertheless, the recent price increase has also allowed the market to penetrate above the 100-day moving average level, which is a very potent bullish signal. Furthermore, the RSI has also recently established ground above the 50 level, which indicates that the bulls are back in charge of the market momentum.
Can the Market Hit $0.45?
If the bullish pressure can continue and allow IOTA/USD to break above the current resistance at $0.3681, we can expect immediate higher resistance above to be located at the short-term 1.272 and 1.414 Fibonacci Extension levels (drawn in blue), priced at $0.377 and $0.3939 respectively.
The bulls will run into strong resistance at the $0.40 level, which is provided by a bearish .618 Fibonacci Retracement (drawn in red). This bearish Fibonacci Retracement level is measured from the November 2018 high to the December 2019 low.
Above $0.40, higher resistance then lies at the 1.618 Fibonacci Extension level (drawn in blue), priced at $0.4178. If the bulls can then continue above $0.43 and $0.44, further resistance will be at the target level of $0.45, which is provided by the bearish .786 Fibonacci Retracement level. IOTA/USD should be able to reach this level within the next few weeks if Bitcoin remains bullish.
Above $0.45, higher resistance lies at $0.47, $0.49, and $0.50.
EOS Price Analysis
What Has Been Going On?
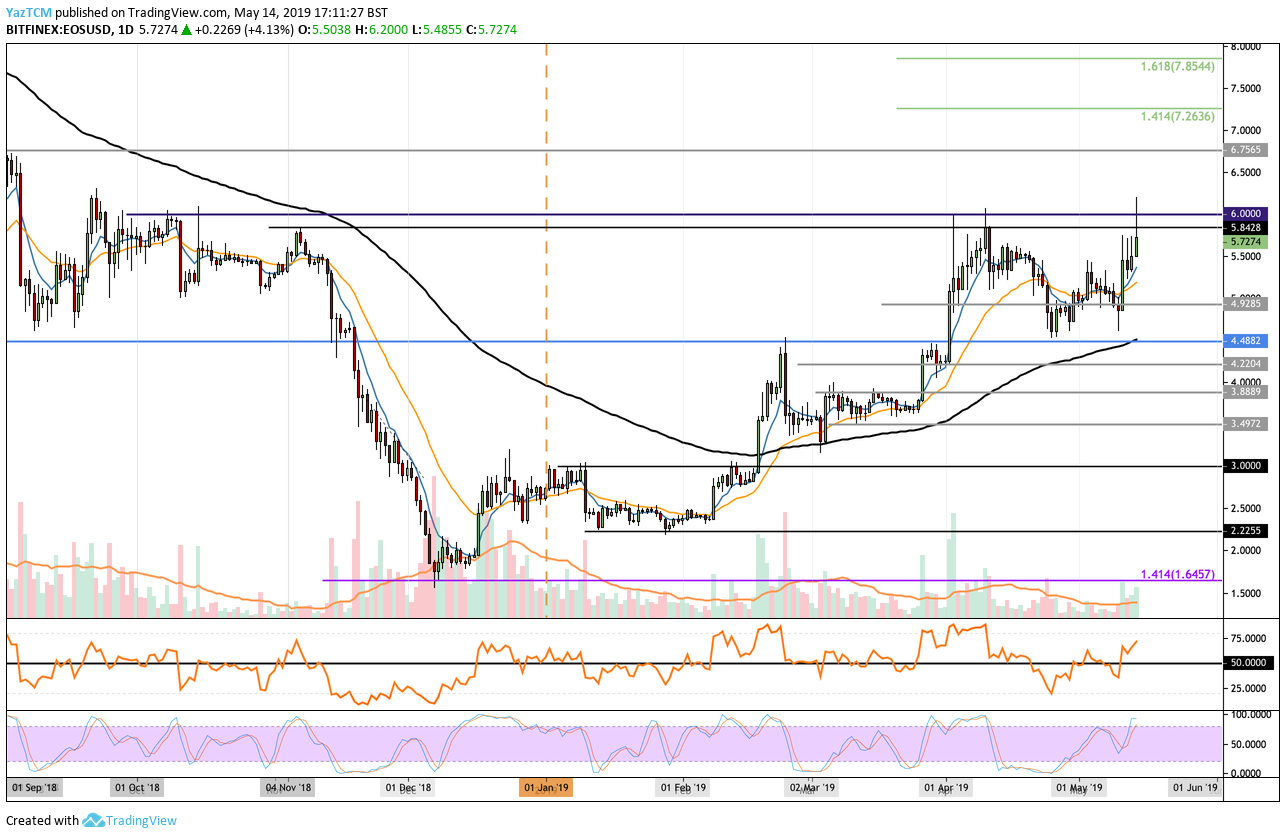
EOS has seen a great year for price action in 2019, as the market is up by a total of 166% from the yearly low. The recent price surge has now allowed EOS/USD to make another attempt at the April 2019 high day close price of around $5.84. If the bulls can break above this, they can make an attempt at the April 2019 high of $6.00.
The RSI has recently broken back above the 50 level, which indicates that the bulls have regained control of the market momentum, which should aid in the battle to break above $6.00.
Can EOS Hit $7.85?
If the bulls are successful in breaking above $5.84 and $6.00, they will be creating another fresh high for 2019. Resistance above $6.00 is then to be expected at $6.50 and $6.75. If the buyers can continue above $6.75, further resistance then lies at the psychological round number of $7.00, and then again at the short-term 1.414 Fibonacci Extension level (drawn in green), priced at $7.26.
If the bullish momentum continues above $7.50, the buyers will be free to make an attempt at the target price of $7.85, which is resistance provided by the short-term 1.618 Fibonacci Extension level (drawn in green).
Conclusion
Cryptocurrencies have most definitely enjoyed strong growth due to the steep Bitcoin price increase. VeChain is currently trading within a descending wedge, but if the buyers can break above, they can easily head toward the $0.00837 resistance level.
Similarly, IOTA is currently trading at $0.36 resistance, but if it can make movement above the $0.40 resistance level, it will be clear to make an attempt at $0.45. EOS is currently attempting to make a fresh 2019 high above $6.00, and if it can break above it can continue its run toward $7.85.