
TRON Price Analysis
TRON has traded sideways over the past 7 trading days as the market has moved by a small 0.12%. The cryptocurrency is now trading at a price of around $0.02639, at the time of writing, and has dropped a small 1.08% over the past 30 trading days.
TRON is ranked in 8th position as it currently holds a. $1.73 billion market cap value.
TRX/USD Price
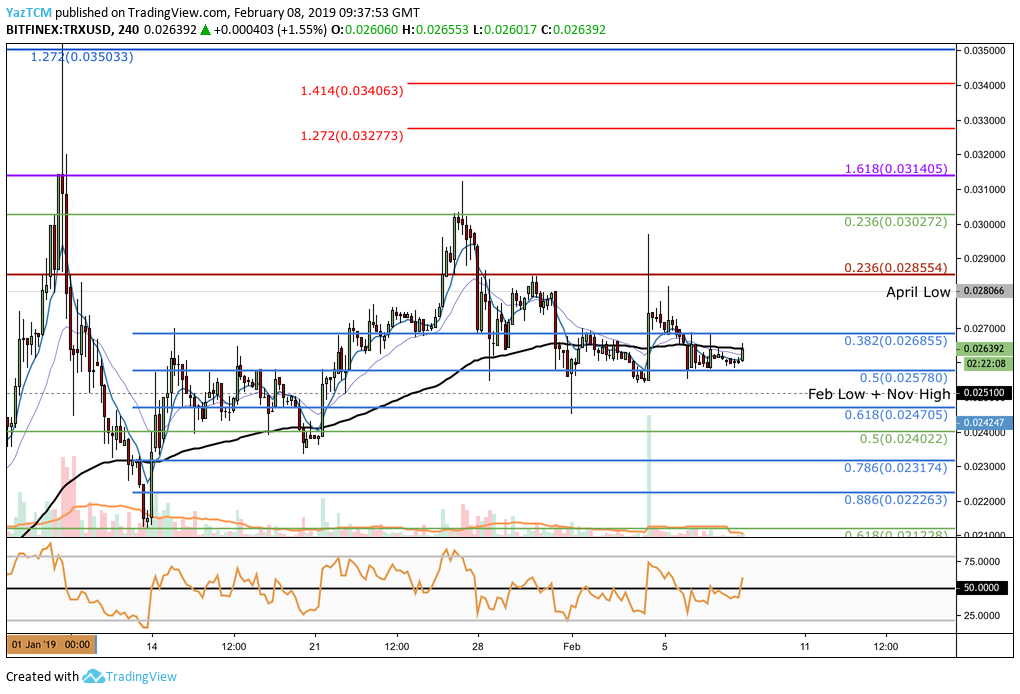
Since our last TRON analysis, price action has failed to hold above the $0.027 handle and has rolled over. The market began to decline slightly and has recently reached support at a very short-term .5 Fibonacci Retracement level (drawn in blue) priced at $0.025780.
The market has traded sideways over the past few days between the aforementioned support at $0.02578 and resistance at the $0.02685 handle.
Trend: Neutral
The previous trend was bullish. However, after price action has failed to create a higher high, we can now assume that the trading condition is neutral as the market trades sideways between the range identified above.
For the bullish trend to continue, we would need to see price action break above the $0.030 handle. For this market to be considered bearish, we would need to see price action break below the $0.025 handle.
Where is the TRX/USD Market Likely to Head Towards Next?
Considering the market is in a trading range, we will need to wait to see which direction the trend will break out from.
If the market breaks above the upper boundary of the trading range at the short-term .382 Fibonacci Retracement level (drawn in blue) priced at $0.02685, we can then expect further higher resistance located at the April 2018 low priced at $0.02806.
This is followed by further resistance around the bearish .236 Fibonacci Retracement level (drawn in red) priced at $0.02855.
If the buyers continue to cause price action to travel higher, there is further resistance above located at the medium-term .236 Fibonacci Retracement level (drawn in green) priced at $0.03027, followed closely by more resistance at the previous medium-term 1.618 Fibonacci Extension level (drawn in purple) priced at $0.031405.
Further resistance above $0.03140 can then be located at the short-term 1.272 and 1.414 Fibonacci Extension levels (drawn in red) priced at $0.03277 and $0.03406, respectively.
What if TRX Price Action Breaks Below the Range?
Alternatively, if TRX/USD price action falls below the support at the $0.025780 handle, we can expect immediate support beneath at the February 2018 low priced at $0.02510, followed by more support at the short-term .618 Fibonacci Retracement level (drawn in blue) priced at $0.02470.
If the selling pressure continues to drive price action lower, there is more support below at the medium-term .5 Fibonacci Retracement level (drawn in green) priced at $0.02402. The next area of support is around the short-term .786 and .886 Fibonacci Retracement levels (drawn in blue) priced at $0.02317 and $0.02226, respectively.
TRX/BTC Price
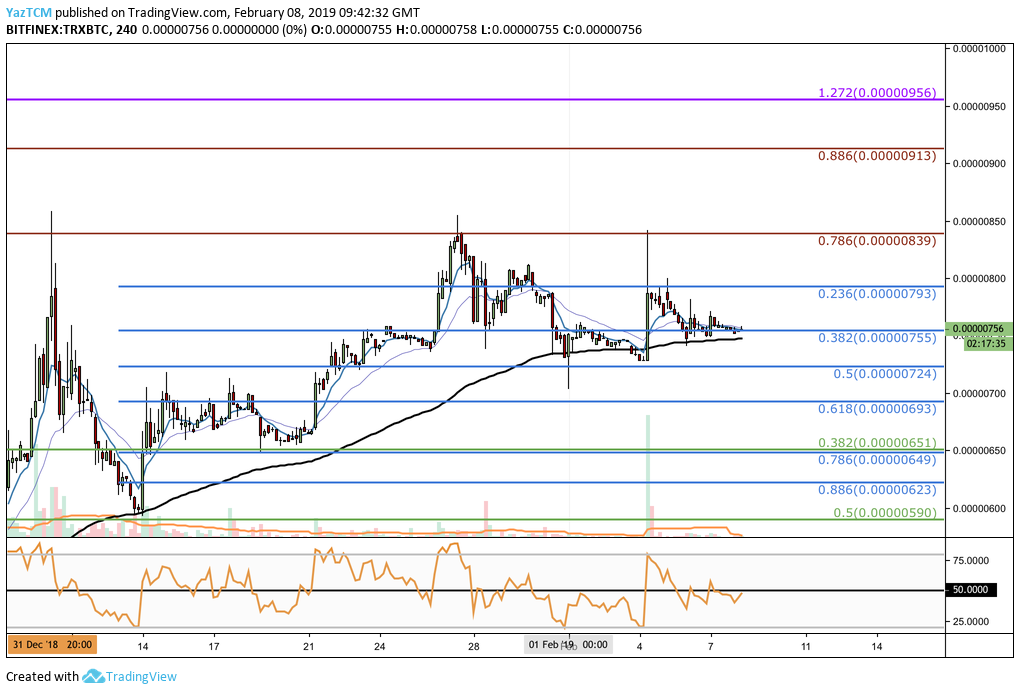
Taking a look at the TRX/BTC 4HR chart above, we can see that since February 4, 2019, price action has traded in a range defined between the short-term .236 and .382 Fibonacci Retracement levels (drawn in blue), priced at 793 SATS and 755 SATS respectively.
The market momentarily spiked higher above the range but met resistance at the bearish .786 Fibonacci Retracement level (drawn in red) priced at 839 SATS and returned back down.
Trend: Neutral
As the market is trading within the range identified above, the trading condition is now deemed to be neutral.
For this market to be considered bullish, we would need to see price action break above the 839 SATS handle. For the market to be considered bearish, price action needs to break below the 724 SATS handle.
Where is TRX/BTC Likely to Head Towards Next?
If the bulls manage to push TRX/BTC above the upper boundary of the trading range at 793 SATS, we can then expect immediate higher resistance at the bearish .786 Fibonacci Retracement level (drawn in red) priced at 839 SATS.
Further resistance above this level can then be expected at the bearish .836 Fibonacci Retracement level (drawn in red) priced at 913 SATS, which is then followed by resistance at the medium-term 1.272 Fibonacci Extension level (drawn in purple) priced at 956 SATS.
What if TRX/BTC Falls Below the Lower Boundary of the Range?
Alternatively, if the market falls below the lower boundary of the trading range, we can then expect immediate support beneath at the short-term .5 and .618 Fibonacci Retracement levels (drawn in blue), priced at 724 SATS and 693 SATS respectively.
If the market continues to fall further beneath the support at 693 SATS, there is more support at the short-term .786 and .886 Fibonacci Retracement levels (drawn in blue), priced at 649 SATS and 623 SATS respectively.
The support at 649 SATS is also bolstered by the medium-term .382 Fibonacci Retracement level (drawn in green) priced in the same area, adding to the expected support in the area.
Conclusion
After such an impressive bullish surge from the TRON market recently, it is expected that the market may pull back to rest at some point. The recent switch from a bullish to a neutral trading condition is a natural process within the market as the bulls take a short break before commencing the next swing leg higher.
Provided that TRX can stay above the $0.025 handle, we can expect that the market will continue to climb higher and break above $0.030 once again.