
- Support for TRX moving forward: $0.02510, $0.02402, $0.02122, $0.020, $0.01725, $0.01488.
- Resistance for TRX moving forward: $0.02681, $0.02739, $0.03027, $0.03140, $0.03503, $0.03689.
TRON Price Analysis
Over the past 24 hours of trading, TRON has seen a price decline of 4.94% which has brought the current trading price down to around $0.02645, at the time of writing. The cryptocurrency is still up by 1.50% over the past 7 trading days, with a further 32.14% price surge over the previous 30 trading days.
Now ranked in 8th position with a $1.75 billion market cap, the 17-month old project is now trading at a value that is 89% lower than the all-time high price.
TRX/USD Price
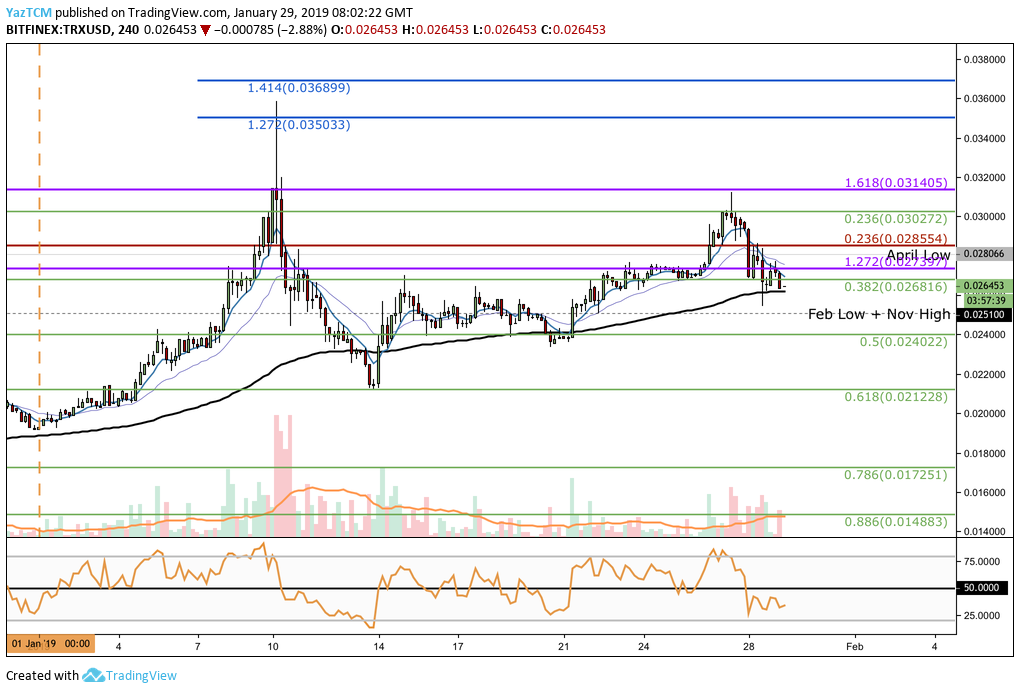
Taking a look at the 4-hour TRX/USD chart above, we can see that following our last price analysis, price action for TRX went on to break above the resistance at the medium-term 1.272 FIbonacci Extension level (drawn in purple) priced at $0.02739.
The market continued to travel higher until it met resistance at the short-term .236 Fibonacci Retracement level (drawn in green) priced at $0.03027. More specifically, the market met resistance at the medium-term 1.618 Fibonacci Extension level (drawn in purple) priced at $0.03140.
After reaching this area of resistance, the market rolled over and began to decline slightly. Price action is now trading marginally below resistance at the .382 Fibonacci Retracement level (drawn in blue) priced at $0.02681.
Trend: Bullish
The trend is still bullish in the short term. We would need to see price action break cleanly above the $0.031 handle for it to continue.
For this market to be considered bearish, price action would need to break below the $0.024 handle.
Where is TRX/USD Headed to Next?
If the bulls can push price action higher above the resistance at $0.02618, we can expect immediate higher resistance at the previous medium-term 1.272 Fibonacci Extension level (drawn in purple) priced at $0.02739. This is immediately followed by higher resistance at the short-term .236 Fibonacci Retracement level (drawn in green) priced at $0.03027.
If the bullish momentum continues, there is more resistance above at the medium-term 1.618 Fibonacci Extension level (drawn in purple) priced at $0.03140.
Following that, more resistance higher can be located at the short-term 1.272 and 1.414 Fibonacci Extension levels (drawn in blue), priced at $0.03503 and $0.03689 respectively.
What if the Bears Push TRX/USD Lower?
Alternatively, if the sellers drive price action lower, there is immediate support towards the downside at the February 2018 low, priced at $0.02510. This is closely followed by more support at the short-term .5 Fibonacci Retracement level (drawn in green) priced at $0.02402.
If the market falls below the $0.024 handle, we can expect more support at the .618 Fibonacci Retracement level (drawn in green) priced at $0.02122.
Below the $0.020 handle, more support can then be expected at the short-term .786 and .886 Fibonacci Retracement level (drawn in green), priced at $0.01725 and $0.01488 respectively.
TRX/BTC Price
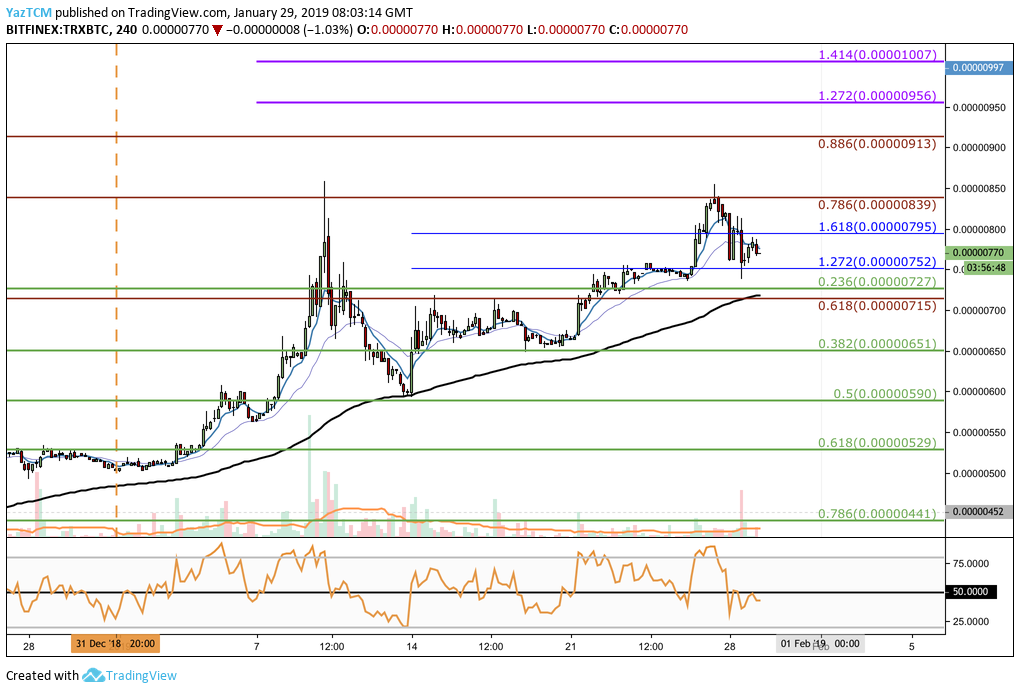
From the 4-hour chart above for ETH/BTC, we can see that since our last ETH/BTC analysis, price action had broken above the resistance zone at the short-term 1.272 Fibonacci Extension level (drawn in blue) priced at 752 SATS.
After breaking above, price action continued to travel higher until it met resistance at the bearish .786 Fibonacci Retracement level (drawn in red) priced at 839 SATS.
After reaching this area of resistance, the market then rolled over and started to decline to where it is currently trading around the 770 SATS handle.
Trend: Bullish
The market remains bullish in the short term. For this market to be considered bearish, we would need to see price action break below the 590 SATS handle.
Where Could TRX/BTC Head towards Next?
If the buyers continue to drive price action higher, once again we can expect immediate higher resistance to be located at the bearish .786 Fibonacci Retracement level (drawn in red) priced at 839 SATS.
Further resistance above this can then be expected at the bearish .886 Fibonacci Retracement level (drawn in red) priced at 913 SATS.
More resistance above this level can be found at the short-term 1.272 and 1.414 Fibonacci Extension levels (drawn in purple), priced at 956 SATS and 1,007 SATS respectively.
What if the Sellers Regain Control?
If the sellers begin to take control of the market momentum and push price action lower, immediate support towards the the downside can be located at the short-term .236 Fibonacci Retracement level (drawn in green) priced at 727 SATS.
If the bearish pressure persists and pushes TRX/BTC even lower, we can expect more support below at the short-term .382 and .5 Fibonacci Retracement levels (drawn in green), priced at 651 SATS and 590 SATS respectively.
If the market breaks below 550 SATS, there is more support at the short-term .618 and .786 Fibonacci Retracement levels (drawn in green), priced at 529 SATS and 441 SATS respectively.
Conclusion
TRON has been on a tear recently, despite the falling prices in the rest of the crypto market. While Bitcoin continues to fall, we will be closely watching the TRX/BTC action to see if price action can break above the 839 SATS handle and head toward 1,000 SATS.