
The Tron surge has continued this past week, seeing TRX rise by a total of 15% and bringing the current price for the cryptocurrency up to around $0.0337. The cryptocurrency has now seen an impressive 42% price rise over the past 30 trading days.

Source: CoinCheckup
The cryptocurrency price surge comes days after CCID China recently published another cryptocurrency ranking report, which saw Tron retain its second positiion within the rankings.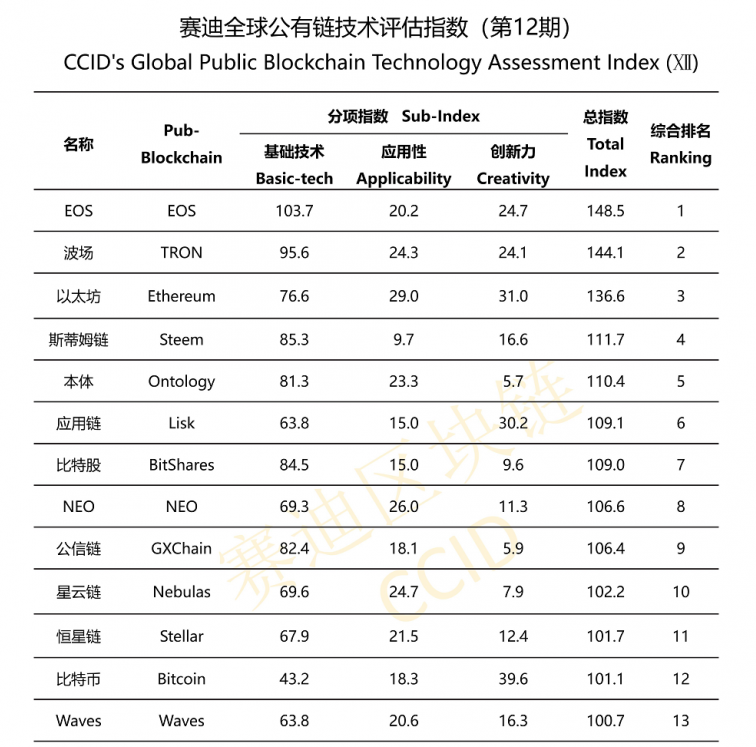
Source: CCID
The CCID is the Chinese government-sponsored cryptocurrency index which analyzes a cryptocurrency’s technology, application, and innovation to come up with a total index score, which is then ranked.
Tron joined the top 5 cryptocurrency projects during February 2019, and has remained in the second postion ever since. Tron is ahead of major cryptocurrencies such as Ethereum, Ontology, and Bitcoin.
Tron remains ranked in the 11th position among the top cryptocurrency projects by market cap valuation. It currently holds a $2.24 billion market cap value and currently sits a small $60 million behind 10th position holder, Cardano (ADA).
Let us continue to take a look at the Tron market and proceed to highlight some potential areas of support and resistance moving forward.
Tron Price Analysis
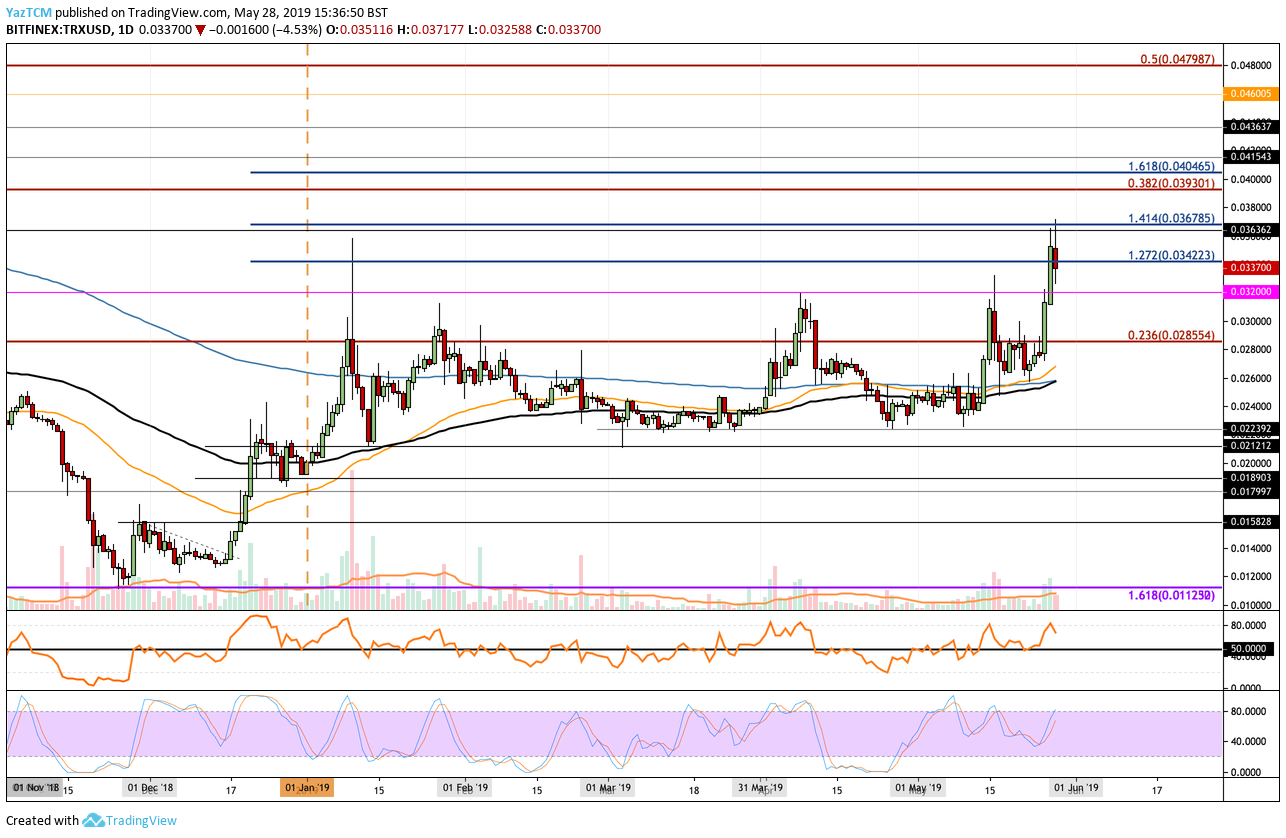
TRX/USD – MEDIUM TERM – DAILY CHART
What Has Been Going On?
Taking a look at the TRX/USD daily chart above, we can see that the recent price surge has allowed Tron to break and close up above the $0.032 level for the first time since early August 2018.
The cryptocurrency went on to climb even further higher away from $0.032 to reach the resistance at the medium-term 1.414 Fibonacci Extension level (drawn in blue), priced at $0.03678. Price action has since fallen from this level of resistance, and now sits at $0.03370.
What Is the Current Trend?
Since Tron managed to break above the resistance at $0.032, we can consider the market a bullish one in the short term. For this bullish trend to be invalidated, we would need to see Tron fall and break beneath the $0.030 level.
Where Is the Resistance Above the Market?
If the buyers continue to cause Tron to rise higher against the US Dollar, we can expect the initial resistance above the market to be located at the previous $0.03678 resistance level. Above this, further higher resistance can be located at the $0.038 level, followed with more resistance at the $0.3901 level. The resistance at $0.03901 is provided by a long-term bearish .382 Fibonacci Retracement level (drawn in red), measured from the May 21, 2018 high at $0.0845 to the December 2018 low.
Resistance above this is closely followed at the medium-term 1.618 Fibonacci Extension level (drawn in blue), priced at $0.4046. If the buyers can continue even further higher, we can expect more resistance to be located at $0.4154, $0.04363, and $0.46.
Above $0.46, the final level of resistance to highlight is located at the long-term bearish .5 Fibonacci Retracement level (drawn in red), priced at $0.04798.
What If the Sellers Take Control?
Alternatively, if the sellers regroup and push the market lower, we can expect immediate support at the $0.033 and $0.032 level. Beneath $0.032, further support then lies at the $0.02854, $0.028, and $0.026.
What Are the Technical Indicators Showing?
The RSI has recently reached overbought conditions and turned away. So long as the RSI can remain above the 50 level during the retracement, we can expect the bulls to stay in charge of the market momentum.
Furthermore, during the past week the 50-day EMA has crossed above the 200-day EMA, signaling a Golden Crossover, which is very bullish in the long term moving forward.
Conclusion
The fact that the CCID ranks Tron so high speaks volumes to the project. Despite the backlash that Tron faces on a day-to-day basis due to its history, the cryptocurrency project continues to flourish and will soon be joining the top 10 ranked projects once again if the bullish ride continues further higher.