
- TRON has reached a major milestone with the creation of 900,000 accounts in just 178 days.
- The market has recently spiked up above the $0.016 handle, turning the market into a bullish trend condition.
- Support moving forward: $0.01637, $0.01524, $0.014844, $0.013775, $0.013361, $0.012600, $0.011901, $0.011230.
- Resistance moving forward: $0.017972, $0.018646, $0.019480, $0.020679, $0.022, $0.02320, $0.02510, $0.02695.
Latest TRON News
TRON continues its exponential growth in adoption over the past few weeks.
After hitting a major milestone where over 2.5 million TRON transactions were processed in one day with another 30,000 wallet addresses added, the network has achieved another great feat. The TRON network has reached over 900,000 accounts in just a short 178 days.
This was announced by TRON CEO, Justin Sun:
Congratulations on #TRON mainnet accounts surpassed 900k in 178 days. #TRX $TRX pic.twitter.com/H6TDt1ddKp
— Justin Sun (@justinsuntron) December 18, 2018
The team also recently released TRXMarket, a DEX which allows TRC-20 tokens to be traded amongst each other without the need for an exchange to hold the user’s funds.
Adding further to their growing adoption, TRX is now listed on over 100 exchanges, with 159 TRX trading pairs to choose from.
One of the latest additions comes from the crypto exchange giant Binance, which has recently added the TRX/TUSD (Tether-U) trading pair to its platform, further increasing the coin’s liquidity.
Let us continue to take a look at the TRX/USD market and highlight any potential areas of support and resistance moving forward.
TRX Price Analysis
TRON has seen a significant price rise totaling over 14% throughout the past 24 hours of trading, bringing the total 7-day price increase to 21%. The cryptocurrency is now exchanging hands at a price around $0.016, at the time of writing, after suffering a slight 90-day price decline of 19%.
TRON is now ranked in 10th position and currently holds a $1.09 billion market cap valuation. The 15-month old project is now trading at a price that is 93% lower than the all-time high price.
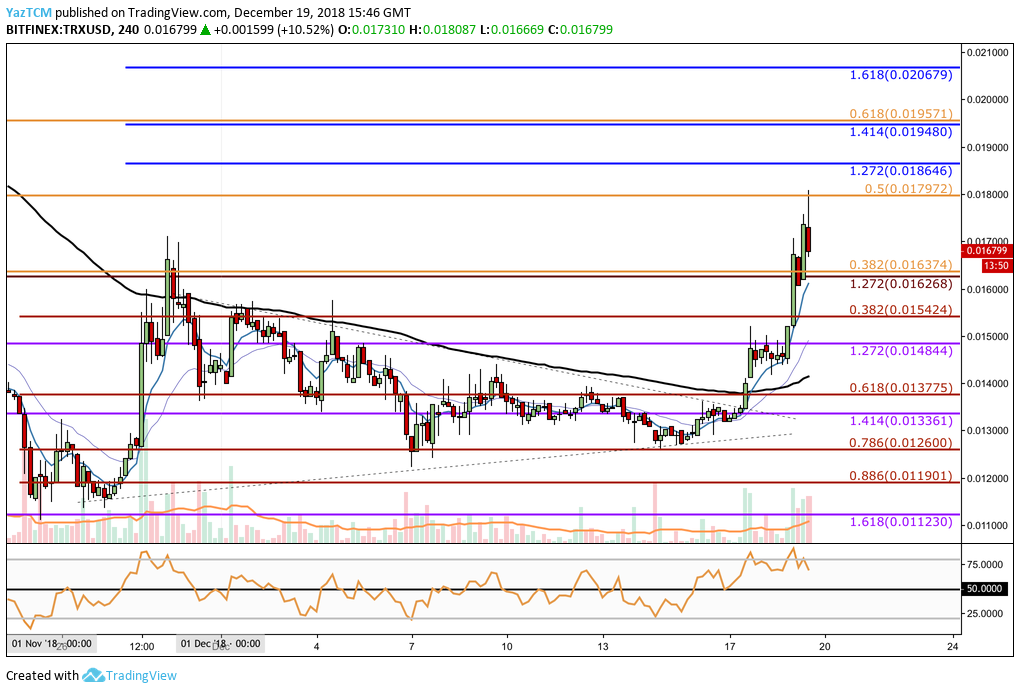
Analyzing price action from the short-term perspective above, we can see that the market has surged since breaking above the support at $0.013361, mentioned in our previous TRX price analysis.
The market has continued to surge and has now hit resistance provided by a bearish .5 Fibonacci Retracement level (drawn in orange) priced at $0.017972.
Trend: Bullish If the Daily Candle Closes Above $0.16
Price action has now recently spiked above the previous high at around $0.016. This brings the market into a bullish trading condition, so long as the daily candle can close above this level.
For the TRX/USD market to now turn bearish, we would need to see price action plummet and break below the short-term .786 Fibonacci Retracement level (drawn in red) priced at $0.012600.
Where is the Resistance for TRX Above $0.017?
If the buyers can continue to drive price action higher in the following days, we can expect immediate resistance toward the upside to be located at the short-term 1.272 Fibonacci Extension level (drawn in blue) priced at $0.018646.
This is closely followed by combined resistance at the 1.414 Fibonacci Extension level (Drawn in blue) priced at $0.019 and the bearish .618 Fibonacci Retracement level (drawn in orange) priced in the same area.
If the bulls continue to drive up price action further, we can then expect more resistance above at the short-term 1.618 Fibonacci Extension level (drawn in blue) priced at $0.02067. If the bulls continue even higher, more resistance can be expected at the November 2018 high priced at $0.025.
What If the TRX Market Rolls Over and Retraces?
If the market begins to pull back, we can expect immediate support toward the downside to be located at the the previous long-term downside 1.272 Fibonacci Extension level (drawn in red) priced at $0.01626.
This is closely followed by the short-term .382 Fibonacci Retracement level (drawn in red) priced at $0.01542.
More support toward the downside can then be located at the short-term .618 and .786 Fibonacci Retracement levels (drawn in red), priced at $0.013775 and $0.012600 respectively.
In the case that the sellers push price action below $0.012600, the market would be considered bearish once again.
Support below would then be expected at the .886 Fibonacci Retracement level (drawn in red) priced at $0.01190, followed by the downside long-term 1.618 Fibonacci Extension level (drawn in purple) priced at $0.011230.
What Are the Technical Indicators Showing?
The RSI is well into bullish territory at this moment in time, on the 4-hour time frame, indicating that the bulls are in charge of the market momentum.
So long as the RSI stays above the 50 handle, we can expect the bullish drive to continue.
The RSI is also in overbought territory on the daily time frame which may indicate that the buyers could be exhausted at some point in the near future. In this case, the market would need to retrace slightly before being able to climb higher and create fresh new highs again.
Conclusion
The Tron adoption curve is nothing short of impressive. The team has continued to attract more users as the account milestone reached the 900,000 mark. This, coupled with the increase in transactions processed per day, makes it evident that people are still drawn to the TRON project.