
- Stellar has announced a series of community-focused updates over the past 2 weeks.
- The market has rebounded from the yearly low at $0.093 to where it is currently reading around $0.1269.
- Support moving forward: $0.1218, $0.1164, $0.1116, $0.10, $0.09859, $0.09329.
- Resistance moving forward: $0.1271, $0.1398, $0.1484, $0.1563, $0.1682, $0.1912, $0.20, $0.2142.
Latest Stellar News
The Stellar team has been making strides in the growth of its community, as seen in the tweet below:
Infographic. Incredible growth of #Stellar Network in 2018. @StellarOrg $xlm
Data from https://t.co/ws3Cx3uUzU pic.twitter.com/zUQtJkHrLL— OrbitLens (@orbitlens) November 21, 2018
As a result, the Stellar team has started to release a series of community vision updates, with the aim of involving the community as much as possible.
The first update provides an overview of the launch of Stellar Clusters which are local community gatherings and meet-ups led by dedicated Stellar community leaders. While the Clusters will be registered with the Stellar Development Foundation (SDF), they will be community-led and receive no funding from the SDF.
The first part of the series also touches on the Stellar Global Conference, for which preparations have started, with more news to come in early 2019.
The second update is on the Stellar Lumens Distribution Programs that are currently active.
One of them is the Stellar Community Fund (SCF) which is intended to award projects that the community deems of high value for the Stellar ecosystem. The SCF will be ran by community-voted leaders who will be elected twice a year, giving them 6 months each to help organize and distribute funds within the SCF.
The team also provided an update on the Partnership Grant which is designed to provide support for exceptional projects within the Stellar ecosystem. So far, the SDF has awarded a total of 34 companies. You can learn more at the new dedicated website for the Partnership Grants.
Perhaps one of the most exciting distribution program to be launched is the Academic Research Program which will provide funding for high-quality academic research related to the improvement of the Stellar ecosystem.
Now, let’s take a look at price action for XLM/USD over the short term and highlight any potential areas of support and resistance.
XLM Price Analysis
Stellar has seen a small price rise totaling 0.46% over the previous 24-hour trading session as the market now is exchanging hands at a price of $0.1267, at the time of writing.
The XLM market has seen a further price increase of 19.63% over the past 7 trading days after suffering a precipitous price decline totaling over 37% throughout the past trading month.
Stellar is now ranked in 6th position and presently retains a $2.39 billion market cap. The 53-month old project is now trading at a value that is 85% lower than its all-time high price.
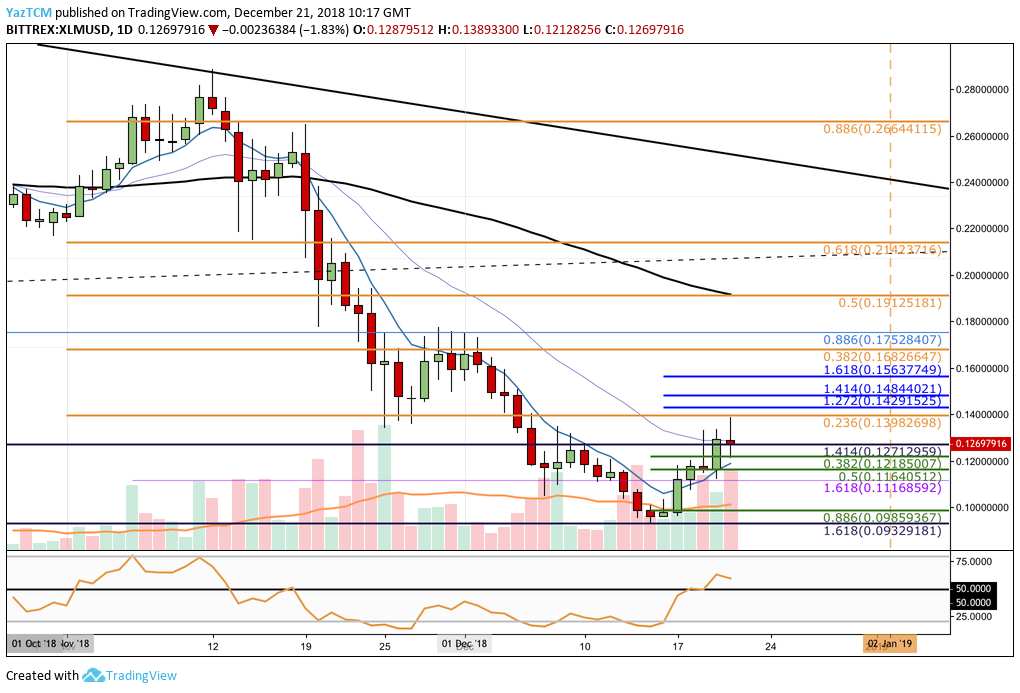
Taking a look at the XLM/USD price chart above, we can see that the market had dropped below our expected support region at the medium-term downside 1.618 Fibonacci Extension level (drawn in purple) priced at $0.1116.
Price action continued to fall until the market rebounded at a long-term downside 1.618 Fibonacci Extension level (drawn in dark blue) priced at $0.09329.
After reaching this area of support, we can see that the market rebounded over the following 5 days. Then XLM/USD price recently stalled as it met resistance at the bearish .236 Fibonacci Retracement level (drawn in orange) priced at $0.1398.
Trend: Bullish Above $0.18
The XLM/USD market is still recovering as it now enters a phase of consolidation. The previous bear trend has ceased, for the time being, as price action experienced a short -term bullish run.
For the XLM/USD market to be considered bullish, we would need to see price action head above the $0.18 handle.
Where is the Resistance for XLM Above $0.1398?
If the bulls can continue to climb higher above the immediate resistance at $0.1398, further higher resistance can be located at the short-term 1.414 and 1.618 Fibonacci Extension level (drawn in blue,) priced at $0.1484 and $0.1537.
If the buyers climb higher, we can expect more resistance above to be located at the bearish .382 and .5 Fibonacci Retracement levels (drawn in orange), priced at $0.1682 and $0.1912 respectively.
In the case that XLM/USD can break above the 100-day moving average and the $0.20 handle, higher resistance can then be located at the bearish .618 and .886 Fibonacci Retracement levels (drawn in orange), priced at $0.2142 and $0.2664 respectively.
What If the Sellers Cause the XLM Market to Reverse?
If the bears regroup and begin to push price action lower, support below can be located at the short-term .382 and .5 Fibonacci Retracement levels (drawn in green), priced at $0.1218 and $0.1164 respectively.
Further support below can then be expected at the $0.10 handle, followed by the previous long-term downside 1.618 Fibonacci Extension level (drawn in dark blue) priced at $0.09329.
Conclusion
Stellar continues to gain a higher level of adoption among its community members. With the recent community-focused updates, we can expect the members of the ecosystem to contribute further to the development of Stellar from a non-coding basis.
Although the XLM market may have seen a short-term rise, price action still has a long way to go before being able to recover the majority of the losses seen during the market collapse in November 2018.