- Support for XRP moving forward: $0.3185, $0.3106, $0.3028, $0.2989, $0.2858.
- Resistance for XRP moving forward: $0.3291, $0.3361, $0.3449, $0.3635, $0.3943, $0.4178, $0.4280, $0.4542.
Ripple Price Analysis
Ripple has seen a small price rise totaling 0.69% over the past 24 hours of trading, bringing the current trading price up to $0.3206. The cryptocurrency has now seen a 7-day price decline totaling 3.20%, with a further 15.99% price fall over the past 90 trading days.
Ripple is ranked in 2nd position and currently holds a $13.02 billion market cap valuation.
XRP/USD Price
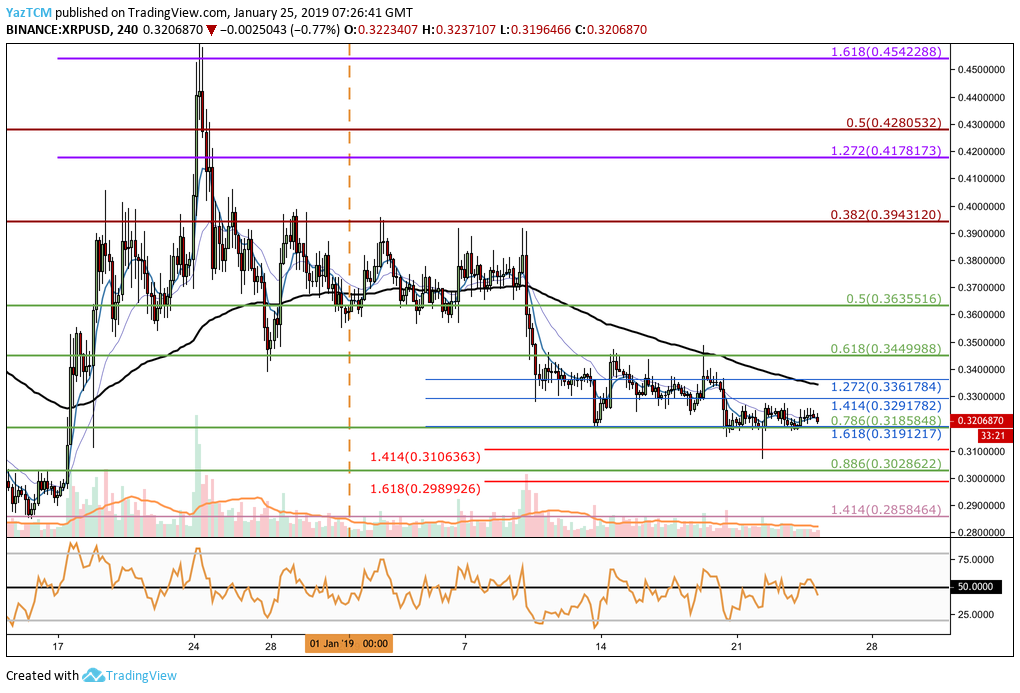
A look at the market from the 4-hour perspective above will show that price action continues to trade sideways along the lower boundary of the current trading range.
Support for the lower boundary of the trading range is provided by the short-term .786 Fibonacci Retracement level (drawn in green) priced at $0.3185. This support is further bolstered by a short-term downside 1.618 Fibonacci Extension level (drawn in blue) priced in the same region.
Trend: Neutral
As the market is still trading within the current trading range between $0.3449 and $0.3185, the current trend is still neutral.
If price action breaks below the lower boundary of the range, then the short-term trend will be seen as bearish. For this market to be considered bullish, we would need to see price action break above the upper boundary of the trading range.
Where is the Support Below the Trading Range?
If the sellers push XRP/USD below the lower boundary of the range, we can expect immediate further support below at a short-term downside 1.414 Fibonacci Extension level (drawn in red) priced at $0.3106. This support is closely followed by more support at the short-term .886 Fibonacci Retracement level (drawn in green) priced at $0.3028.
If XRP/USD breaks further below the $0.30 handle, more support below can be located at the short-term downside 1.618 Fibonacci Extension level (drawn in red) priced at $0.2989.
Further support below is then to be expected at the previous long-term downside 1.414 Fibonacci Extension level (drawn in lilac) priced at $0.2858. This support level had caused the market to rebound during December 2018 so strong support is expected in this area.
Where will the Market Meet Resistance Towards the Upside?
If the bulls begin to push price action higher for XRP/USD, immediate resistance towards the upside can be expected at the short-term 1.414 and 1.272 Fibonacci Extension levels (drawn in blue), priced at $0.3291 and $0.3361 respectively.
This is followed by further resistance at the upper boundary of the trading range located at the short-term .618 Fibonacci Retracement level (drawn in green) priced at $0.3449.
If the buyers push price action above the upper boundary of the range, then we can expect more resistance above at the short-term .5 Fibonacci Retracement level (drawn in green) priced at $0.3635.
There is further resistance towards the upside located at the bearish .382 and .5 Fibonacci Retracement level (drawn in red) priced at $0.3943 and $0.4280.
XRP/BTC Price
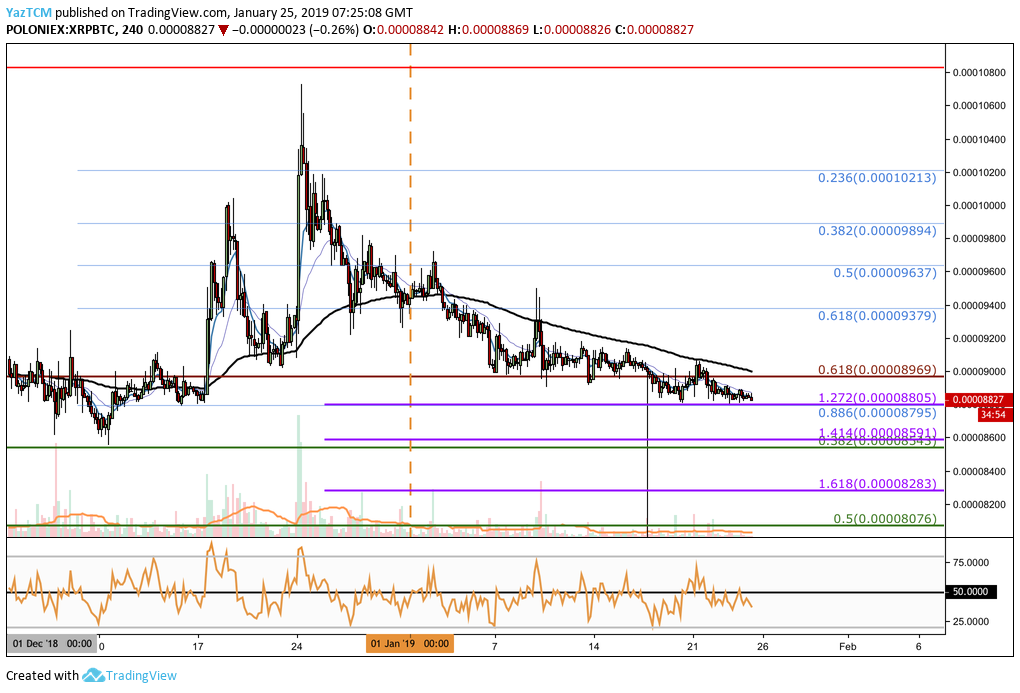
Taking a look at XRP/BTC over the 4-hour chart above, we can see that the market continues to trade sideways since our last analysis.
The market is trading at a short-term downside 1.272 Fibonacci Retracement level (drawn in purple) priced at 8,805 SATS. The support in this area is further bolstered by the short-term .886 Fibonacci Retracement level (drawn in blue) priced in the same area.
The market has held well at this support over the past 5 trading days but if the bearish pressure increases we can expect price action to break below.
Trend: Neutral
The market is still trading within a neutral trading condition as it trades along support at 8,805 SATS.
If price action goes on to fall below this support level, we can then expect the market condition to turn bearish in the short term. For this market to be considered bullish, a price action break above 10,000 SATS is needed.
Where is the Support Located Below the 8,805 SATS Handle?
If the sellers push price action below the 8,805 SATS handle, there is immediate support beneath at the short-term downside 1.414 Fibonacci Extension level (drawn in purple) priced at 8,591 SATS. This is closely followed by more support at the medium-term .382 Fibonacci Retracement level (drawn in green) priced at 8543 SATS.
If the price of XRP/BTC falls further, we can expect more support below at the short-term downside 1.618 Fibonacci Extension level (drawn in purple) priced at 8,283 SATS. This is followed by more support at the medium-term .5 Fibonacci Retracement level (drawn in green) priced at 8,076 SATS.
Where is the Resistance Above the Current Market Price?
If the bulls begin to push price action higher from the support at the 8,805 SATS, there is resistance above at the long-term .618 Fibonacci Retracement level (drawn in red) priced at 8,969 SATS.
If XRP/BTC climbs above the 9,000 SATS handle, then higher resistance can be located at the short-term .618 and .5 Fibonacci Retracement levels (drawn in blue), priced at 9,379 SATS and 9,637 SATS respectively.
Conclusion
Ripple has been testing the lower boundary of the trading range at the $0.31 handle for the past few days now.
Usually, the more times that the market tests the area, the more likely it will eventually break below. Thus, we can expect XRP/USD to break below this support if the market continues to test the area.